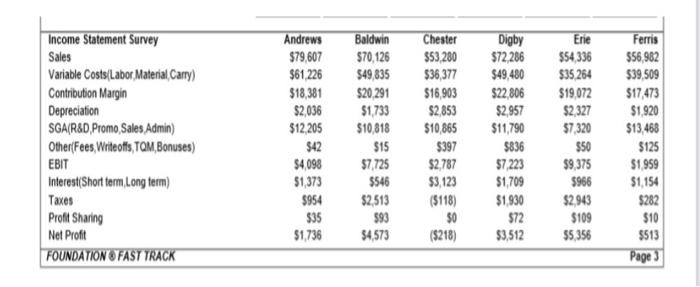
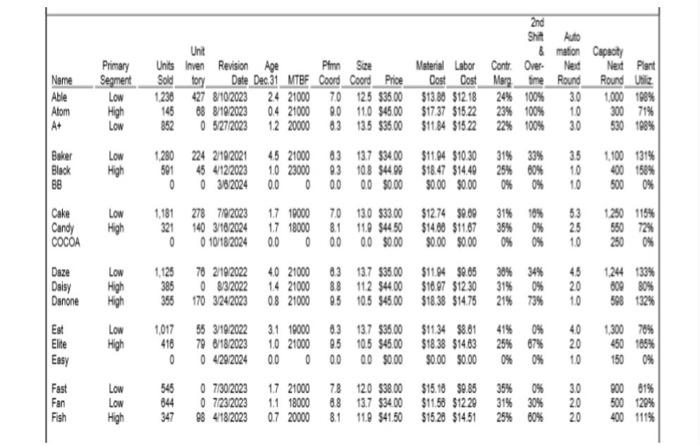
2) Look at the income statement survey. Calculate the contribution margin, net margin and the profit margin (return on sales) for Chester and Erie. Compare the two companies and analyze the differences in their financial management based on your calculations. (18 points) 3) Why does Andrews have the highest sales in the industry but not the highest profits? (4 points) 4) Calculate the ROS for the six companies. Which company is the most profitable? Is this good enough? Why or why not? (8 points) 5) Calculate the contribution margins of the 6 companies. Which company has the best contribution margin? Is this good enough? Why or why not? (10 points) 6) Look at the production page of the FastTrack below and explain why the company with the highest contribution margin in question 5 was able to achieve this. (6 points) 7) Calculate the Net Margins for the 6 companies. Which company has the highest Net margin? Is this good enough? Why or why not? (10 points) 8)After 2 practice rounds, how do you assess the level of sales of the company you manage compared to the industry average? (6 points) (Hint: how have the company's sales grown over the period of 2 years compared to the industry average?). Since the high tech segment grows at around 20% annually and the low tech segment grows at 10% annually, the average overall industry growth is around 15% every year. After 2 practice rounds, is your company sales revenue higher or lower than the average industry level??? Income Statement Survey Sales Variable Costs/Labor Material Carry) Contribution Margin Depreciation SGA/R&D Promo, Sales Admin) Other Fees, Writeoffis, TOM, Bonuses) EBIT Interest(Short term Long term) Taxes Profit Sharing Net Profit FOUNDATION OFAST TRACK Andrews $79,607 $61,226 $18,381 $2,036 $12,205 $42 $4,098 51,373 5954 $35 $1,736 Baldwin $70,126 549,835 $20,291 $1,733 510 818 515 $7.725 $546 $2,513 593 54,573 Chester $53.280 $36,377 S16903 $2,853 $10,865 $397 $2,787 $3,123 (5118) 50 ($218) Digby $72,286 $49,480 $22.806 $2,957 $11,790 $836 57,223 $1,709 $1,930 $72 $3,512 Ere $54,336 $35 264 $19,072 $2,327 $7,320 $50 $9,375 $966 $2.943 $109 $5,356 Ferris $56,962 $39,509 $17,473 $1,920 $13,468 $125 $1,959 $1,154 $282 $10 $513 Page 3 She Name Primary Segment Low 2nd Auto Unt &mation Capacity Units Inven Revision Age Phm Size Material Labor Contr. Over Net Next Part Sold_tory Date Dec 31 MTBF Coord Coord Price Dost Dost Merrime Round Round Uhliz 1.238 427 8/102023 24 21000 70 125 $35.00 $13.88 51218 24% 100% 30 1000 198% 145 88 810202304 21000 80 110 545.00 $17.37 $15.22 23% 100% 10 300 71% 852 0 5272023 12 20000 33 135 $35.00 $1184 91522 22% 100% 30 530 798% Able Atom A+ High Low Baker Low High Black BB * 35 10 10 1.100 131% 400 158% 5000% 1280 224 2102021 45 21000 03 137 $34.00 $11.94 $10.30 31% 33% 50145 4122023 10 23000 93 10.8 $4499 $18.47 $14.49 25% 80% 0 0 382024 00 0 00 00 $0.00 $0.00 $0.00 0% 0% 1,181 278 702023 17 10000 70 130 $33.00 $12.74 $9.09 31% 10% 321 140 318 2024 17 18000 81 119 $4450 $14.00 $11.87 35% 0% 0 0 10/18/2024 0.0 0 0000 $0.00 $0.00 $0.00 0% 0% Cake Candy COCOA Low High 53 25 10 1250 115% 550 72% 250 0% Daze Daisy Danone LON High High 45 20 10 999 1244 133% 809 80% 588 132% Est Elite Easy Low High 1,125 70 210202240 21000 03 137 $35.00 $11.64 $8.65 30% 34% 385 0 832022 14 21000 88 112 $44.00 $18.97 $1230 31% 0% 356 170 3242023 08 21000 95 10.5 545.00 $18.38 $14.75 21% 73% 1,017 55 319/202231 19000 03 137 $35.00 $11.34 $8.61 41% 0% 416 70 618/2023 10 21000 95 10.5 $45.00 $18.38 $1463 25% 87% 0 0 4292024 000 0000 $0.00 $0.00 $0.00 0% 0% 545 07/30/2023 17 21000 78 120 338.00 $15.18 $0.85 35% 0% 844 0 7232023 11 18000 88 13.7 $34.00 $11.58 51220 31% 30% 347 98 418/2023 0.7 20000 81 119 $41.50 51528 $14.51 25% 80% 40 20 10 1300 70% 450 185% 150 0% Fast Fan Low Low High 30 20 20 900 61% 500 120% 400 1114 Fish 2) Look at the income statement survey. Calculate the contribution margin, net margin and the profit margin (return on sales) for Chester and Erie. Compare the two companies and analyze the differences in their financial management based on your calculations. (18 points) 3) Why does Andrews have the highest sales in the industry but not the highest profits? (4 points) 4) Calculate the ROS for the six companies. Which company is the most profitable? Is this good enough? Why or why not? (8 points) 5) Calculate the contribution margins of the 6 companies. Which company has the best contribution margin? Is this good enough? Why or why not? (10 points) 6) Look at the production page of the FastTrack below and explain why the company with the highest contribution margin in question 5 was able to achieve this. (6 points) 7) Calculate the Net Margins for the 6 companies. Which company has the highest Net margin? Is this good enough? Why or why not? (10 points) 8)After 2 practice rounds, how do you assess the level of sales of the company you manage compared to the industry average? (6 points) (Hint: how have the company's sales grown over the period of 2 years compared to the industry average?). Since the high tech segment grows at around 20% annually and the low tech segment grows at 10% annually, the average overall industry growth is around 15% every year. After 2 practice rounds, is your company sales revenue higher or lower than the average industry level??? Income Statement Survey Sales Variable Costs/Labor Material Carry) Contribution Margin Depreciation SGA/R&D Promo, Sales Admin) Other Fees, Writeoffis, TOM, Bonuses) EBIT Interest(Short term Long term) Taxes Profit Sharing Net Profit FOUNDATION OFAST TRACK Andrews $79,607 $61,226 $18,381 $2,036 $12,205 $42 $4,098 51,373 5954 $35 $1,736 Baldwin $70,126 549,835 $20,291 $1,733 510 818 515 $7.725 $546 $2,513 593 54,573 Chester $53.280 $36,377 S16903 $2,853 $10,865 $397 $2,787 $3,123 (5118) 50 ($218) Digby $72,286 $49,480 $22.806 $2,957 $11,790 $836 57,223 $1,709 $1,930 $72 $3,512 Ere $54,336 $35 264 $19,072 $2,327 $7,320 $50 $9,375 $966 $2.943 $109 $5,356 Ferris $56,962 $39,509 $17,473 $1,920 $13,468 $125 $1,959 $1,154 $282 $10 $513 Page 3 She Name Primary Segment Low 2nd Auto Unt &mation Capacity Units Inven Revision Age Phm Size Material Labor Contr. Over Net Next Part Sold_tory Date Dec 31 MTBF Coord Coord Price Dost Dost Merrime Round Round Uhliz 1.238 427 8/102023 24 21000 70 125 $35.00 $13.88 51218 24% 100% 30 1000 198% 145 88 810202304 21000 80 110 545.00 $17.37 $15.22 23% 100% 10 300 71% 852 0 5272023 12 20000 33 135 $35.00 $1184 91522 22% 100% 30 530 798% Able Atom A+ High Low Baker Low High Black BB * 35 10 10 1.100 131% 400 158% 5000% 1280 224 2102021 45 21000 03 137 $34.00 $11.94 $10.30 31% 33% 50145 4122023 10 23000 93 10.8 $4499 $18.47 $14.49 25% 80% 0 0 382024 00 0 00 00 $0.00 $0.00 $0.00 0% 0% 1,181 278 702023 17 10000 70 130 $33.00 $12.74 $9.09 31% 10% 321 140 318 2024 17 18000 81 119 $4450 $14.00 $11.87 35% 0% 0 0 10/18/2024 0.0 0 0000 $0.00 $0.00 $0.00 0% 0% Cake Candy COCOA Low High 53 25 10 1250 115% 550 72% 250 0% Daze Daisy Danone LON High High 45 20 10 999 1244 133% 809 80% 588 132% Est Elite Easy Low High 1,125 70 210202240 21000 03 137 $35.00 $11.64 $8.65 30% 34% 385 0 832022 14 21000 88 112 $44.00 $18.97 $1230 31% 0% 356 170 3242023 08 21000 95 10.5 545.00 $18.38 $14.75 21% 73% 1,017 55 319/202231 19000 03 137 $35.00 $11.34 $8.61 41% 0% 416 70 618/2023 10 21000 95 10.5 $45.00 $18.38 $1463 25% 87% 0 0 4292024 000 0000 $0.00 $0.00 $0.00 0% 0% 545 07/30/2023 17 21000 78 120 338.00 $15.18 $0.85 35% 0% 844 0 7232023 11 18000 88 13.7 $34.00 $11.58 51220 31% 30% 347 98 418/2023 0.7 20000 81 119 $41.50 51528 $14.51 25% 80% 40 20 10 1300 70% 450 185% 150 0% Fast Fan Low Low High 30 20 20 900 61% 500 120% 400 1114 Fish