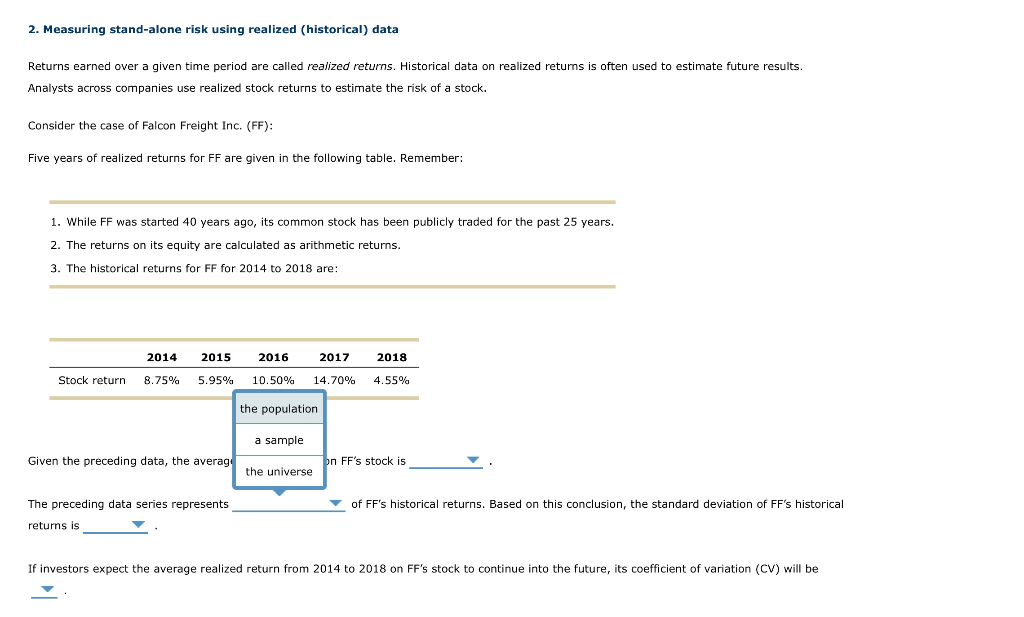
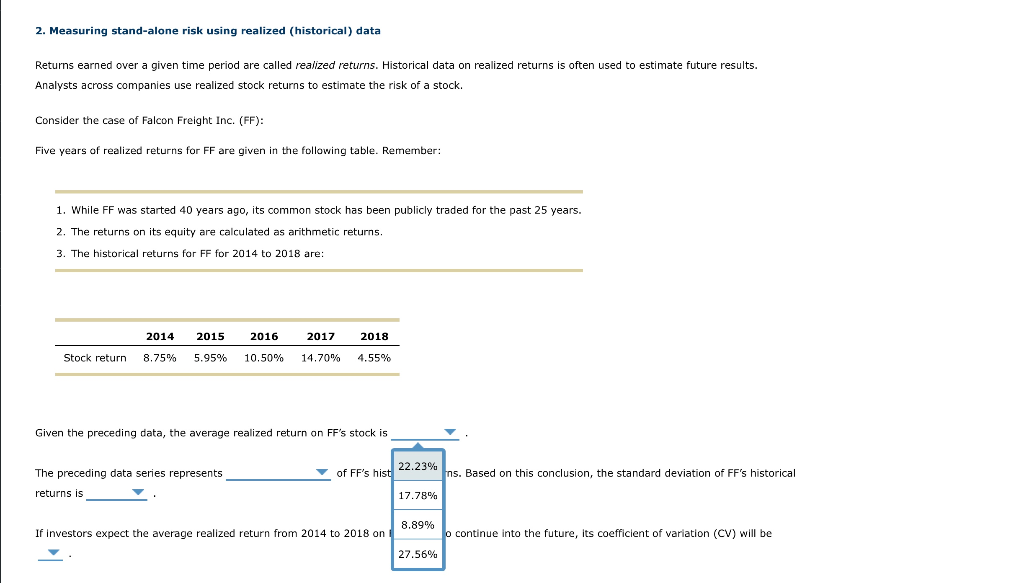
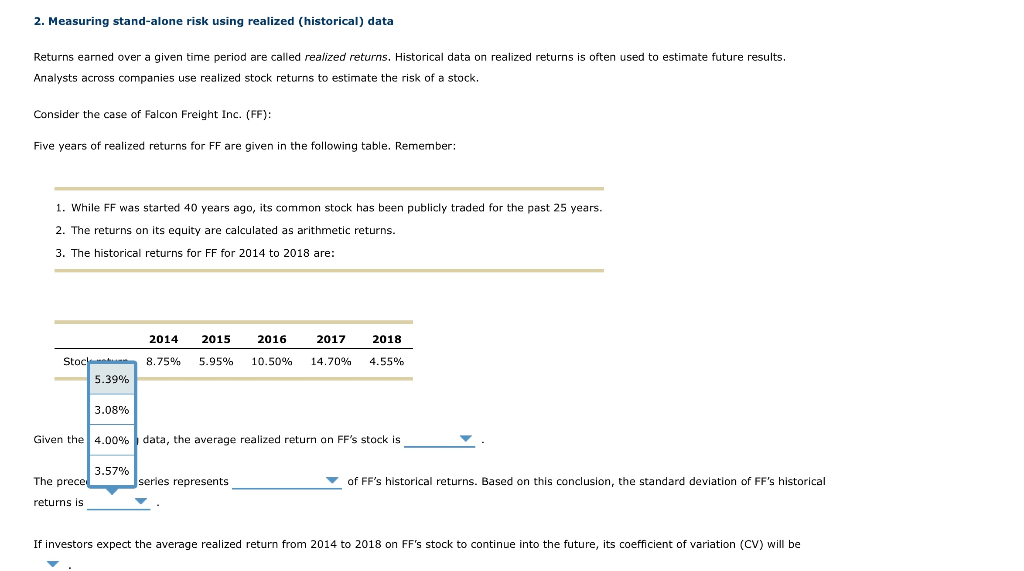
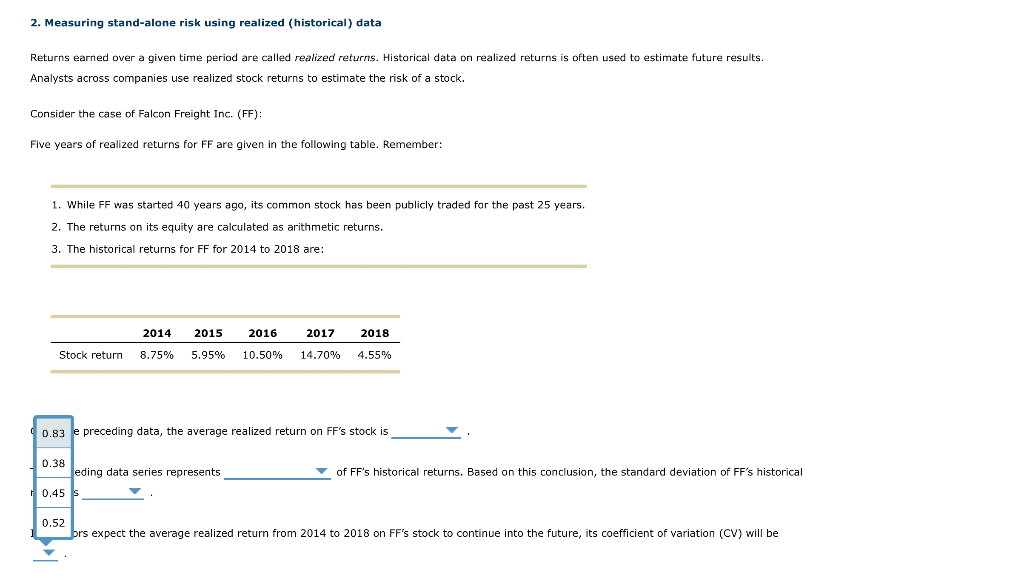
2. Measuring stand-alone risk using realized (historical) data Returns earned over a given time period are called realized returns. Historical data on realized returns is often used to estimate future results. Analysts across companies use realized stock returns to estimate the risk of a stock. Consider the case of Falcon Freight Inc. (FF): Five years of realized returns for FF are given in the following table. Remember: 1. While FF was started 40 years ago, its common stock has been publicly traded for the past 25 years. 2. The returns on its equity are calculated as arithmetic returns. 3. The historical returns for FF for 2014 to 2018 are: 2014 2015 2016 2017 2018 Stock return 8.75% 5.95% 10.50% 14.70% 4.55% the population a sample Given the preceding data, the averag on FF's stock is the universe The preceding data series represents of FF's historical returns. Based on this conclusion, the standard deviation of FF's historical returns is If investors expect the average realized return from 2014 to 2018 on FF's stock to continue into the future, its coefficient of variation (CV) will be 2. Measuring stand-alone risk using realized (historical) data Returns earned over given time period are called realized returns. Historical data on realized returns is often used to estimate future results. Analysts across companies use realized stock returns to estimate the risk of a stock. Consider the case of Falcon Freight Inc. (FF): Five years of realized returns for FF are given in the following table. Remember: 1. While FF was started 40 years ago, its common stock has been publicly traded for the past 25 years. 2. The returns on its equity are calculated as arithmetic returns. 3. The historical returns for FF for 2014 to 2018 are: 2014 2015 2016 2017 2018 Stock return 8.75% 5.95% 10.50% 14.70% 4.55% Given the preceding data, the average realized return on FF's stock is The preceding data series represents returns is 22.23% of FF's hist ns. Based on this conclusion, the standard deviation of FF's historical 17.78% 8.89% If investors expect the average realized return from 2014 to 2018 on o continue into the future, its coefficient of variation (CV) will be 27.56% 2. Measuring stand-alone risk using realized (historical) data Returns earned over a given time period are called realized returns. Historical data on realized returns is often used to estimate future results. Analysts across companies use realized stock returns to estimate the risk of a stock. Consider the case of Falcon Freight Inc. (FF): Five years of realized returns for FF are given in the following table. Remember: 1. While FF was started 40 years ago, its common stock has been publicly traded for the past 25 years. 2. The returns on its equity are calculated as arithmetic returns. 3. The historical returns for FF for 2014 to 2018 are: 2014 2015 2016 2017 2018 8.75% 5.95% 10.50% 14.70% 4.55% Stock 5.39% 3.08% Given the 4.00% data, the average realized return on FF's stock is 3.57% The prece series represents of FF's historical returns. Based on this conclusion, the standard deviation of FF's historical returns is If investors expect the average realized return from 2014 to 2018 on FF's stock to continue into the future, its coefficient of variation (CV) will be 2. Measuring stand-alone risk using realized (historical) data often used to estimate future results. Returns earned over a given time period are called realized returns. Historical data on realized returns Analysts across companies use realized stock returns to estimate the risk of a stock. Consider the case of Falcon Freight Inc. (FF): Five years of realized returns for FF are given in the following table. Remember: 1. While FF was started 40 years ago, its common stock has been publicly traded for the past 25 years. 2. The returns on its equity are calculated as arithmetic returns. 3. The historical returns for FF for 2014 to 2018 are: 2014 2015 2016 2017 2018 Stock return 8.75% 5.95% 10.50% 14.70% 4.55% 0.83 e preceding data, the average realized return on FF's stock is 0.38 eding data series represents 0.45 of FF's historical returns. Based on this conclusion, the standard deviation of FF's historical 0.52 brs expect the average realized return from 2014 to 2018 on FF's stock to continue into the future, its coefficient of variation (CV) will be