

Answered step by step
Verified Expert Solution
Question
1 Approved Answer
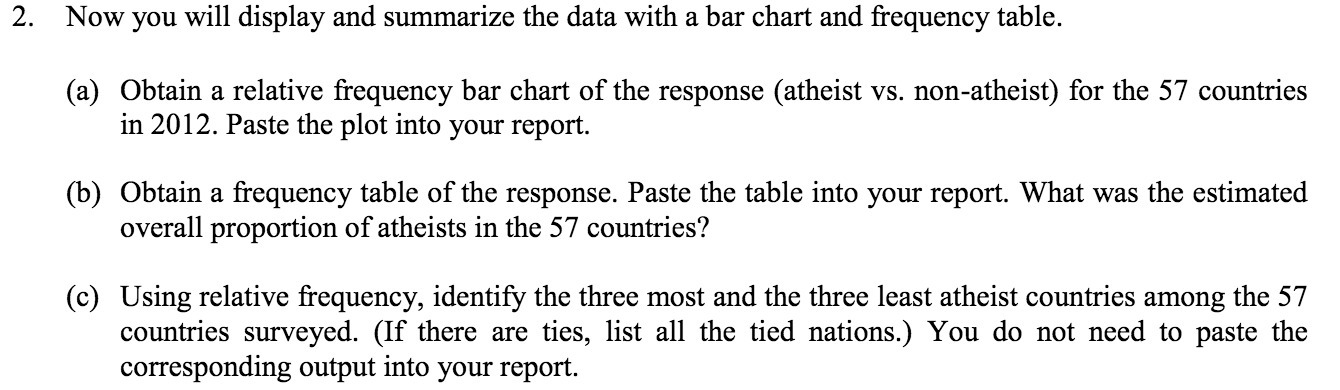
2. Now you will display and summarize the data With a bar chart and frequency table. (a) Obtain a relative frequency bar chart of the
Step by Step Solution
There are 3 Steps involved in it
Step: 1

Get Instant Access to Expert-Tailored Solutions
See step-by-step solutions with expert insights and AI powered tools for academic success
Step: 2

Step: 3
Ace Your Homework with AI
Get the answers you need in no time with our AI-driven, step-by-step assistance
Get Started
Mathematics for Economics and Business
Authors: Ian Jacques
9th edition
129219166X, 9781292191706 , 978-1292191669