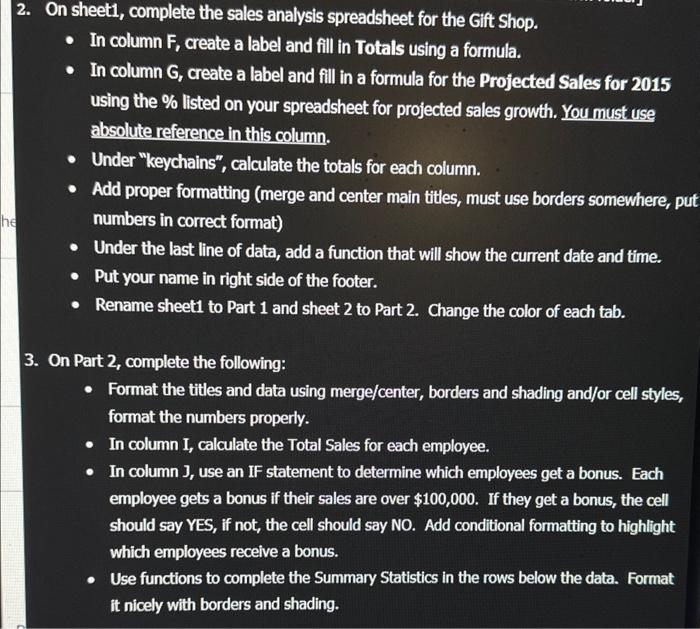
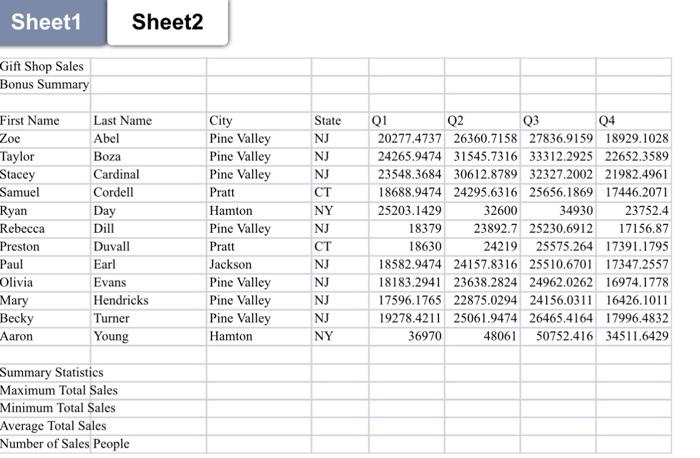
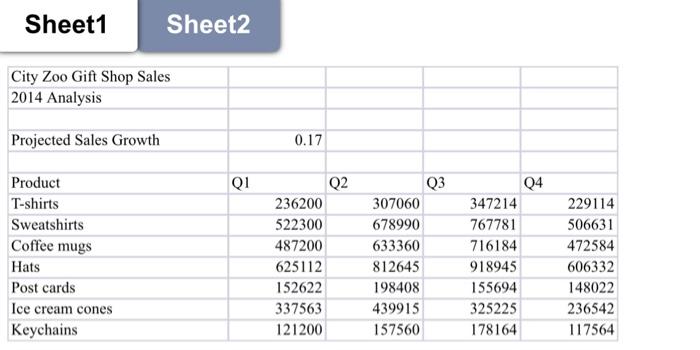
2. On sheet1, complete the sales analysis spreadsheet for the Glft Shop. - In column F, create a label and fill in Totals using a formula. - In column G, create a label and fill in a formula for the Projected Sales for 2015 using the \% listed on your spreadsheet for projected sales growth. You must use absolute reference in this column. - Under "keychains", calculate the totals for each column. - Add proper formatting (merge and center main titles, must use borders somewhere, put numbers in correct format) - Under the last line of data, add a function that will show the current date and time. - Put your name in right side of the footer. - Rename sheet1 to Part 1 and sheet 2 to Part 2. Change the color of each tab. 3. On Part 2, complete the following: - Format the titles and data using merge/center, borders and shading and/or cell styles, format the numbers properly. - In column I, calculate the Total Sales for each employee. - In column J, use an IF statement to determine which employees get a bonus. Each employee gets a bonus if their sales are over $100,000. If they get a bonus, the cell should say YES, if not, the cell should say NO. Add conditional formatting to highlight which employees recelve a bonus. - Use functions to complete the Summary Statistics in the rows below the data. Format it nicely with borders and shading. Sheet2 Sheet1 Sheet2 City Zoo Gift Shop Sales 2014 Analysis Projected Sales Growth 0.17 \begin{tabular}{|l|r|r|r|r|} \hline Product & Q1 & \multicolumn{2}{|c|}{ Q2 } & \multicolumn{2}{|c|}{ Q3 } \\ \hline T-shirts & 236200 & 307060 & 347214 & 229114 \\ \hline Sweatshirts & 522300 & 678990 & 767781 & 506631 \\ \hline Coffee mugs & 487200 & 633360 & 716184 & 472584 \\ \hline Hats & 625112 & 812645 & 918945 & 606332 \\ \hline Post cards & 152622 & 198408 & 155694 & 148022 \\ \hline Ice cream cones & 337563 & 439915 & 325225 & 236542 \\ \hline Keychains & 121200 & 157560 & 178164 & 117564 \\ \hline \end{tabular} 2. On sheet1, complete the sales analysis spreadsheet for the Glft Shop. - In column F, create a label and fill in Totals using a formula. - In column G, create a label and fill in a formula for the Projected Sales for 2015 using the \% listed on your spreadsheet for projected sales growth. You must use absolute reference in this column. - Under "keychains", calculate the totals for each column. - Add proper formatting (merge and center main titles, must use borders somewhere, put numbers in correct format) - Under the last line of data, add a function that will show the current date and time. - Put your name in right side of the footer. - Rename sheet1 to Part 1 and sheet 2 to Part 2. Change the color of each tab. 3. On Part 2, complete the following: - Format the titles and data using merge/center, borders and shading and/or cell styles, format the numbers properly. - In column I, calculate the Total Sales for each employee. - In column J, use an IF statement to determine which employees get a bonus. Each employee gets a bonus if their sales are over $100,000. If they get a bonus, the cell should say YES, if not, the cell should say NO. Add conditional formatting to highlight which employees recelve a bonus. - Use functions to complete the Summary Statistics in the rows below the data. Format it nicely with borders and shading. Sheet2 Sheet1 Sheet2 City Zoo Gift Shop Sales 2014 Analysis Projected Sales Growth 0.17 \begin{tabular}{|l|r|r|r|r|} \hline Product & Q1 & \multicolumn{2}{|c|}{ Q2 } & \multicolumn{2}{|c|}{ Q3 } \\ \hline T-shirts & 236200 & 307060 & 347214 & 229114 \\ \hline Sweatshirts & 522300 & 678990 & 767781 & 506631 \\ \hline Coffee mugs & 487200 & 633360 & 716184 & 472584 \\ \hline Hats & 625112 & 812645 & 918945 & 606332 \\ \hline Post cards & 152622 & 198408 & 155694 & 148022 \\ \hline Ice cream cones & 337563 & 439915 & 325225 & 236542 \\ \hline Keychains & 121200 & 157560 & 178164 & 117564 \\ \hline \end{tabular}