

Answered step by step
Verified Expert Solution
Question
1 Approved Answer
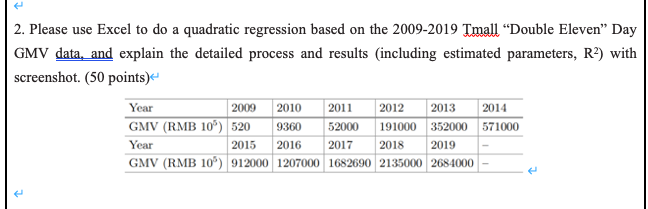
2. Please use Excel to do a quadratic regression based on the 2009-2019 Tmall Double Eleven Day GMV data, and explain the detailed process and
Step by Step Solution
There are 3 Steps involved in it
Step: 1

Get Instant Access to Expert-Tailored Solutions
See step-by-step solutions with expert insights and AI powered tools for academic success
Step: 2

Step: 3
Ace Your Homework with AI
Get the answers you need in no time with our AI-driven, step-by-step assistance
Get Started
Empirical Techniques In Finance
Authors: Ramaprasad Bhar, Shigeyuki Hamori
1st Edition
3642064175, 978-3642064173