

Answered step by step
Verified Expert Solution
Question
1 Approved Answer
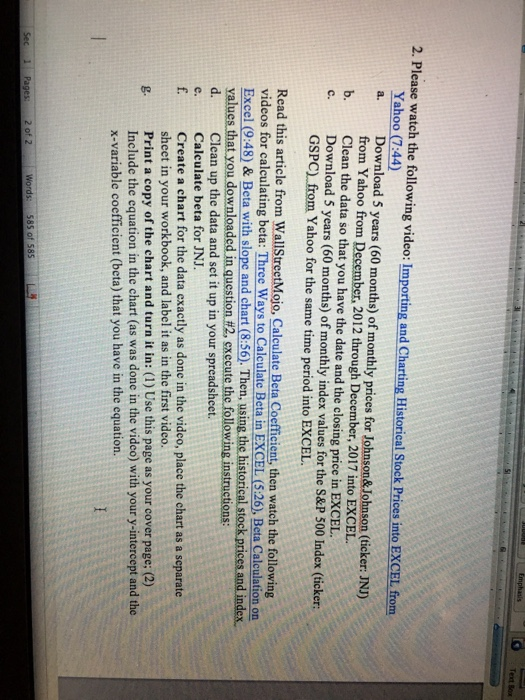
2. Please watch the following video: Importing and Charting Historical Stock Prices into EXCEL from Yahoo (7:44) a. Download 5 years (60 months) of monthly
Step by Step Solution
There are 3 Steps involved in it
Step: 1

Get Instant Access to Expert-Tailored Solutions
See step-by-step solutions with expert insights and AI powered tools for academic success
Step: 2

Step: 3
Ace Your Homework with AI
Get the answers you need in no time with our AI-driven, step-by-step assistance
Get Started
Basic Finance An Introduction to Financial Institutions Investments and Management
Authors: Herbert B. Mayo
10th edition
1111820635, 978-1111820633