

Question: 2. Prepare a multiple regression table using all three of the activities as the independent variable. Using the output from the multiple rearession give the
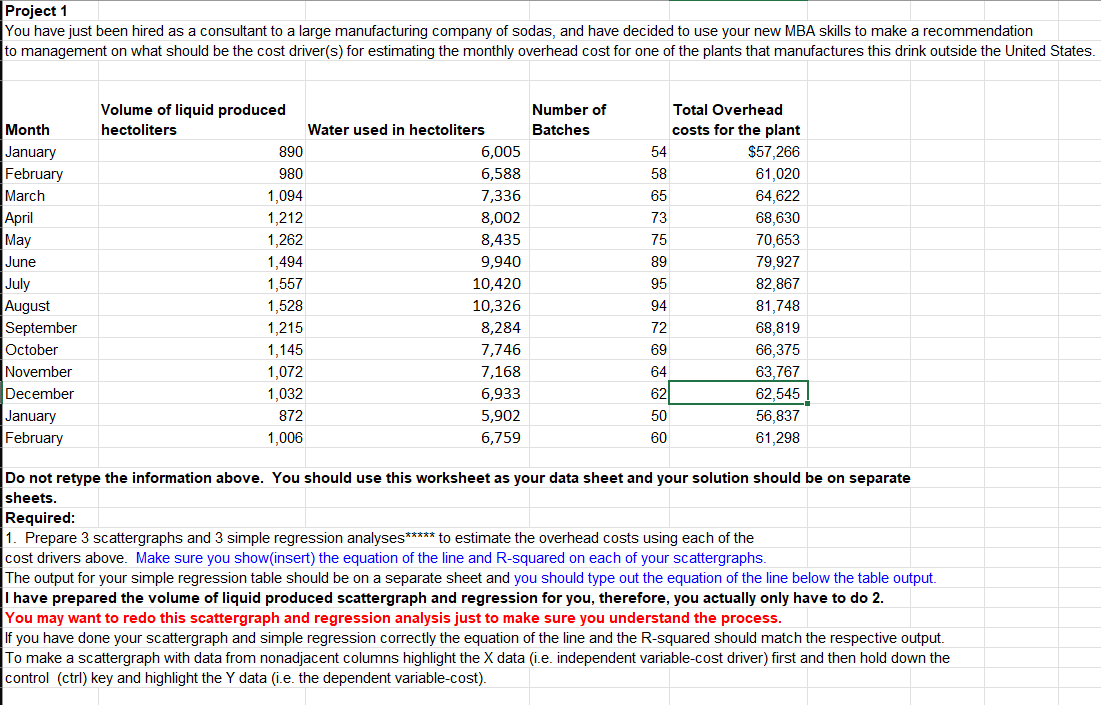
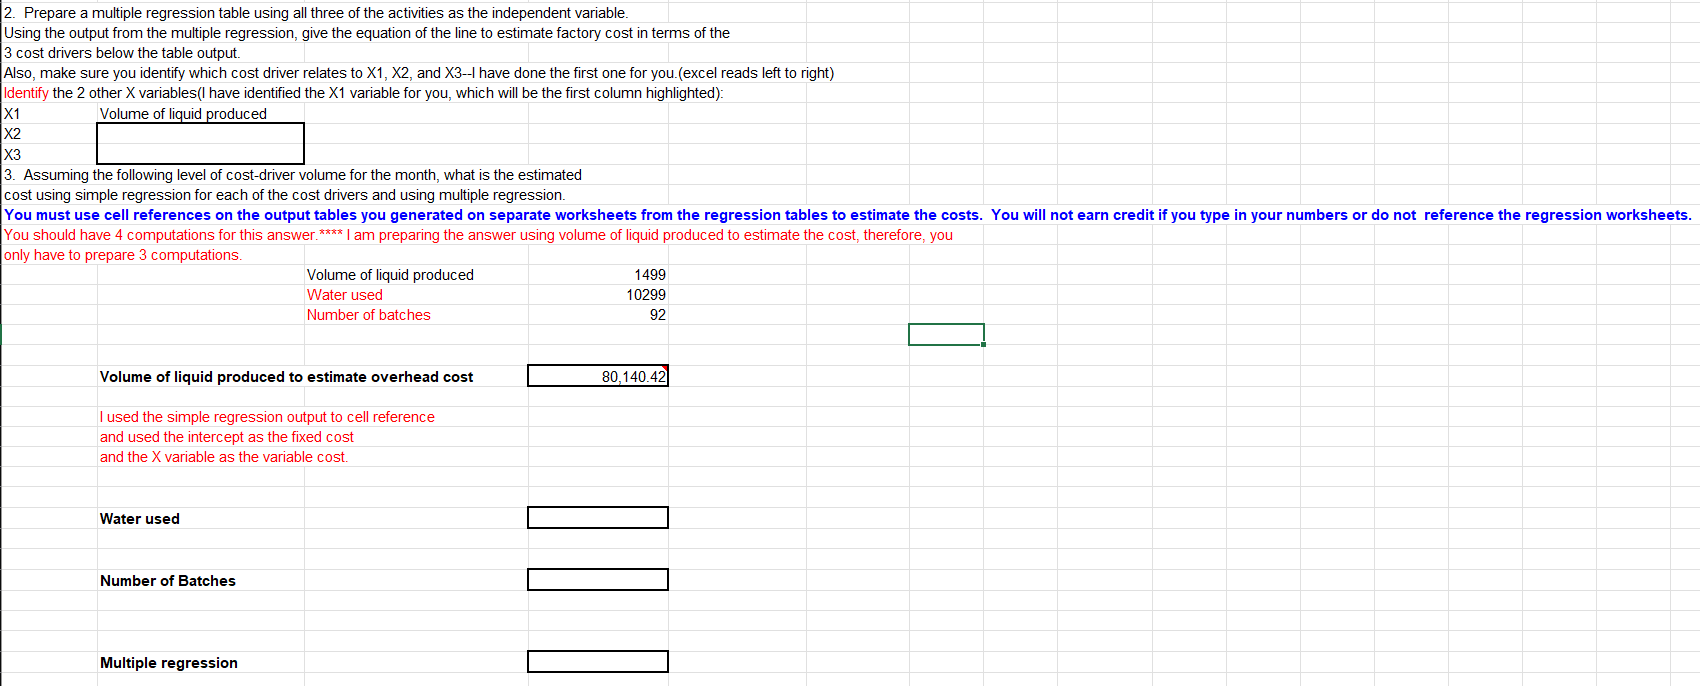
2. Prepare a multiple regression table using all three of the activities as the independent variable. Using the output from the multiple rearession give the equation of the line to estimate factory cost in terms of the 3 cost drivers below the table output Also, make sure you identify which cost driver relates to X1,X2, and X3I have done the first one for you.(excel reads left to right) Identify the 2 other X variables(I have identified the X1 variable for you, which will be the first column highlighted): Using the simple and multiple regression analyses analysis you performed, what independent variable(s) would you recommend o estimate the Overhead Costs? Why? You need to provide and discuss the specific R-squared provided in your analysis for each independent variable and multiple variables. Your response must be a detailed recommendation of why you provided that recommendation and include a discussion of the R-Squared along with providing the specific R-squared results. You have just been hired as a consultant to a large manufacturing company of sodas, and have decided to use your new MBA skills to make a recommendation to management on what should be the cost driver(s) for estimating the monthly overhead cost for one of the plants that manufactures this drink outside the United States. Do not retype the information above. You should use this worksheet as your data sheet and your solution should be on separate sheets. Required: 1. Prepare 3 scattergraphs and 3 simple regression analyses to estimate the overhead costs using each of the cost drivers above. Make sure you show(insert) the equation of the line and R-squared on each of your scattergraphs. The output for your simple regression table should be on a separate sheet and you should type out the equation of the line below the table output. I have prepared the volume of liquid produced scattergraph and regression for you, therefore, you actually only have to do 2 . You may want to redo this scattergraph and regression analysis just to make sure you understand the process. If you have done your scattergraph and simple regression correctly the equation of the line and the R-squared should match the respective output. To make a scattergraph with data from nonadjacent columns highlight the X data (i.e. independent variable-cost driver) first and then hold down the control (ctrl) key and highlight the Y data (i.e. the dependent variable-cost). 2. Prepare a multiple regression table using all three of the activities as the independent variable. Using the output from the multiple rearession give the equation of the line to estimate factory cost in terms of the 3 cost drivers below the table output Also, make sure you identify which cost driver relates to X1,X2, and X3I have done the first one for you.(excel reads left to right) Identify the 2 other X variables(I have identified the X1 variable for you, which will be the first column highlighted): Using the simple and multiple regression analyses analysis you performed, what independent variable(s) would you recommend o estimate the Overhead Costs? Why? You need to provide and discuss the specific R-squared provided in your analysis for each independent variable and multiple variables. Your response must be a detailed recommendation of why you provided that recommendation and include a discussion of the R-Squared along with providing the specific R-squared results. You have just been hired as a consultant to a large manufacturing company of sodas, and have decided to use your new MBA skills to make a recommendation to management on what should be the cost driver(s) for estimating the monthly overhead cost for one of the plants that manufactures this drink outside the United States. Do not retype the information above. You should use this worksheet as your data sheet and your solution should be on separate sheets. Required: 1. Prepare 3 scattergraphs and 3 simple regression analyses to estimate the overhead costs using each of the cost drivers above. Make sure you show(insert) the equation of the line and R-squared on each of your scattergraphs. The output for your simple regression table should be on a separate sheet and you should type out the equation of the line below the table output. I have prepared the volume of liquid produced scattergraph and regression for you, therefore, you actually only have to do 2 . You may want to redo this scattergraph and regression analysis just to make sure you understand the process. If you have done your scattergraph and simple regression correctly the equation of the line and the R-squared should match the respective output. To make a scattergraph with data from nonadjacent columns highlight the X data (i.e. independent variable-cost driver) first and then hold down the control (ctrl) key and highlight the Y data (i.e. the dependent variable-cost)
Step by Step Solution
There are 3 Steps involved in it

Get step-by-step solutions from verified subject matter experts