

Answered step by step
Verified Expert Solution
Question
1 Approved Answer
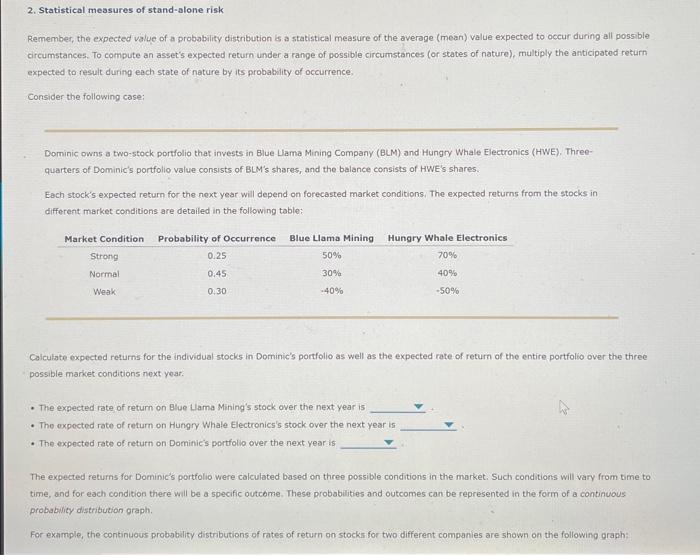
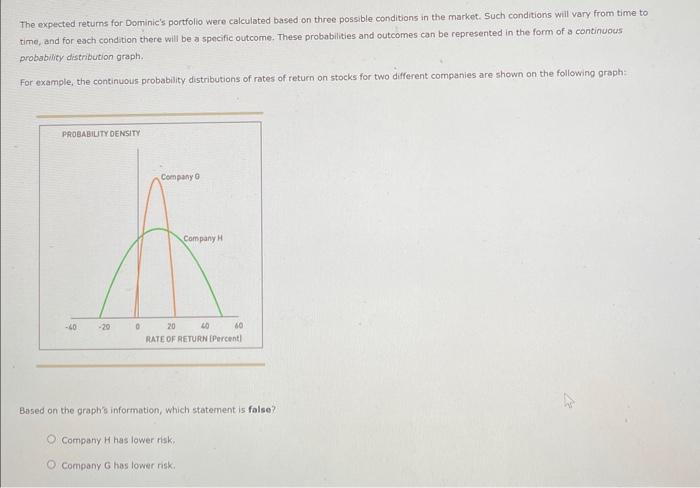
2. Statistical measures of stand-alone risk Remember, the expected value of a probability chistnbution is a statistical measure of the averoge (mean) value expected to
Step by Step Solution
There are 3 Steps involved in it
Step: 1

Get Instant Access to Expert-Tailored Solutions
See step-by-step solutions with expert insights and AI powered tools for academic success
Step: 2

Step: 3
Ace Your Homework with AI
Get the answers you need in no time with our AI-driven, step-by-step assistance
Get Started
Family Child Care Audit Manual Strategies For Protecting Your Business In An IRS Audit RedLeaf Business Series
Authors: Tom Copeland
1st Edition
1929610211, 978-1929610211