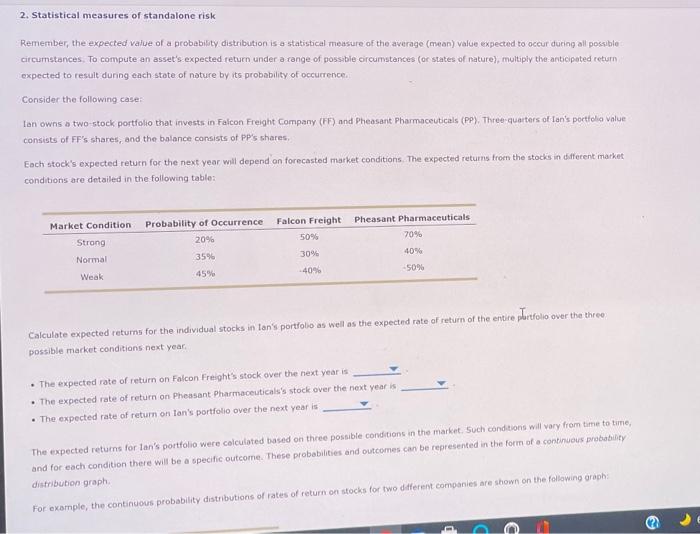
2. Statistical measures of standalone risk Remember, the expected value of a probability distribution is a statistical measure of the average (mean) value expected to occur during all possible circumstances. To compute an asset's expected return under a range of possible circumstances (or states of nature), multiply the anticipated return expected to result danng each state of nature by its probability of occurrence Consider the following cases lan owns a two-stock portfolio that invests in Falcon Freight Company (FF) and Pheasant Pharmaceuticals (PP). Three quarters of Ian's portfolio value consists of FF's shares, and the balance consists of PP's shares Ench stock's expected return for the next year will depend on forecasted market conditions. The expected returns from the stocks in different market conditions are detailed in the following table: Market Condition Strong Normal Probability of Occurrence 20% Falcon Freight 50% Pheasant Pharmaceuticals 70% 40% 3596 30% -40% -5096 Weak 45% over the three Calculate expected returns for the individual stocks in tan's portfolio as well as the expected rate of return of the entire plutfolio possible market conditions next year The expected rate of return on Falcon Freights stock over the next year is The expected rate of return on Pheasant Pharmaceuticals's stock over the next year is The expected rate of return on Ian's portfolio over the next year is The expected returns for lan's portfolio were calculated based on three possible conditions in the market. Such conditions will vary from time to time, and for each condition there will be a specific outcome. These probabilities and outcomes can be represented in the form of a continuous probability distribution graph For example, the continuous probability distributions of rates of return on stocks for two different companies are shown on the following graph: 2 6