Answered step by step
Verified Expert Solution
Question
1 Approved Answer
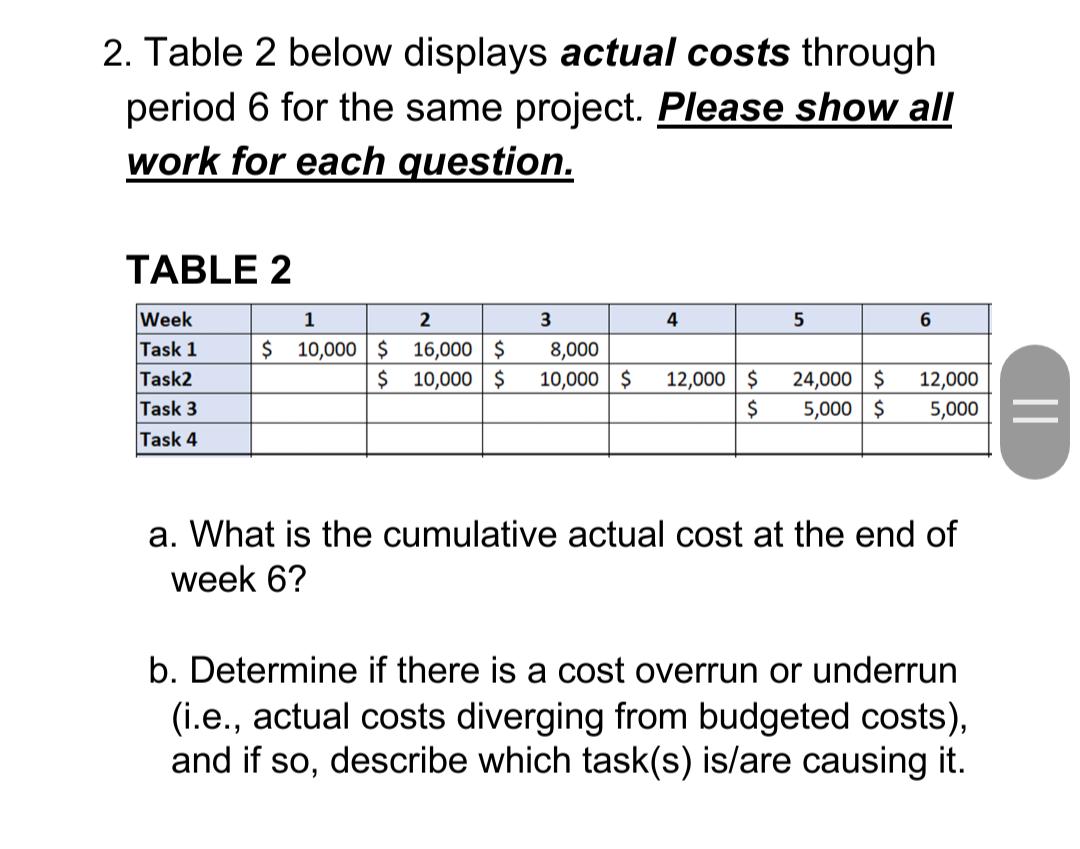
2. Table 2 below displays actual costs through period 6 for the same project. Please show all work for each question. TABLE 2 Week

2. Table 2 below displays actual costs through period 6 for the same project. Please show all work for each question. TABLE 2 Week 1 2 3 4 5 6 Task 1 $ 10,000 $16,000 $ 8,000 Task2 Task 3 $ 10,000 $ 10,000 $ 12,000 $ 24,000 $ 12,000 $ 5,000 $ 5,000 Task 4 || a. What is the cumulative actual cost at the end of week 6? b. Determine if there is a cost overrun or underrun (i.e., actual costs diverging from budgeted costs), and if so, describe which task(s) is/are causing it. 2. Table 2 below displays actual costs through period 6 for the same project. Please show all work for each question. TABLE 2 Week 1 2 3 4 5 6 Task 1 $ 10,000 $16,000 $ 8,000 Task2 Task 3 $ 10,000 $ 10,000 $ 12,000 $ 24,000 $ 12,000 $ 5,000 $ 5,000 Task 4 || a. What is the cumulative actual cost at the end of week 6? b. Determine if there is a cost overrun or underrun (i.e., actual costs diverging from budgeted costs), and if so, describe which task(s) is/are causing it.
Step by Step Solution
★★★★★
3.36 Rating (149 Votes )
There are 3 Steps involved in it
Step: 1
To determine the cumulative actual cost at the end of week 6 we need to sum up the actual costs for ...
Get Instant Access to Expert-Tailored Solutions
See step-by-step solutions with expert insights and AI powered tools for academic success
Step: 2

Step: 3

Ace Your Homework with AI
Get the answers you need in no time with our AI-driven, step-by-step assistance
Get Started


