

Question
2. Taxes and welfare Consider the market for mountain bikes. The following graph shows the demand and supply for mountain bikes before the government imposes
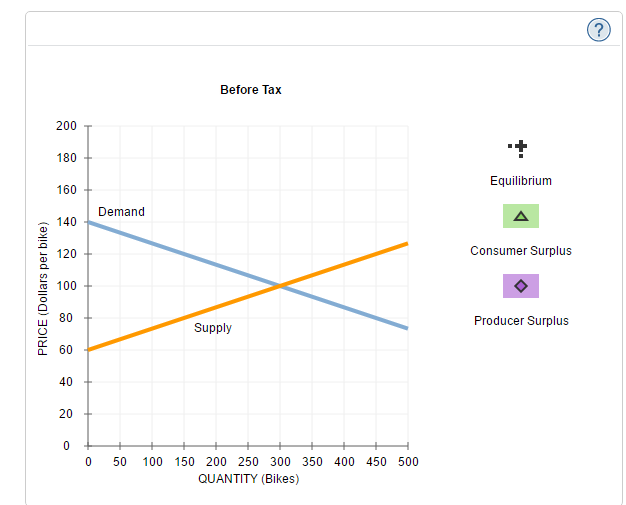
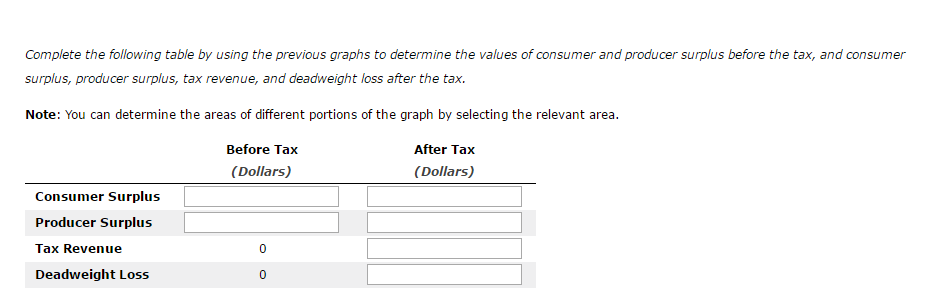
2. Taxes and welfare Consider the market for mountain bikes. The following graph shows the demand and supply for mountain bikes before the government imposes any taxes. First, use the black point (plus symbol) to indicate the equilibrium price and quantity of mountain bikes in the absence of a tax. Then use the green point (triangle symbol) to shade the area representing total consumer surplus (CS) at the equilibrium price. Next, use the purple point (diamond symbol) to shade the area representing total producer surplus (PS) at the equilibrium price.
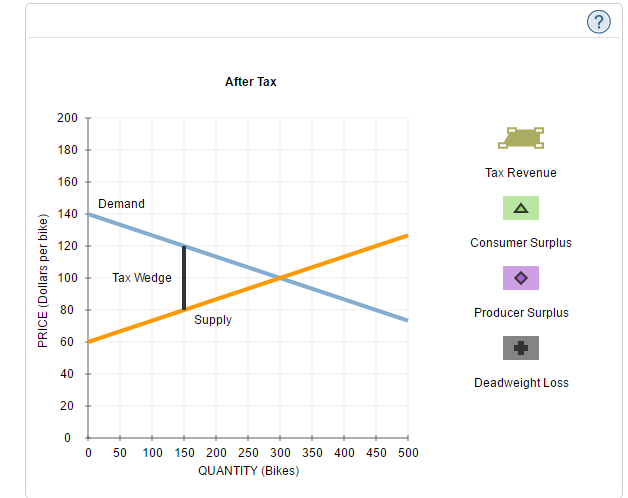
Suppose the government imposes an excise tax on mountain bikes. The black line on the following graph shows the tax wedge created by a tax of $40 per bike.
First, use the tan quadrilateral (dash symbols) to shade the area representing tax revenue. Next, use the green point (triangle symbol) to shade the area representing total consumer surplus after the tax. Then, use the purple point (diamond symbol) to shade the area representing total producer surplus after the tax. Finally, use the black point (plus symbol) to shade the area representing deadweight loss.
Before Tax 200 180 160 Demand 40 20 100 w 80 Supp 60 40 20 0 50 00 50 200 250 300 350 400 450 500 QUANTITY Bikes Equilibrium Consumer Surplus Producer Surplus
Step by Step Solution
There are 3 Steps involved in it
Step: 1

Get Instant Access to Expert-Tailored Solutions
See step-by-step solutions with expert insights and AI powered tools for academic success
Step: 2

Step: 3
Ace Your Homework with AI
Get the answers you need in no time with our AI-driven, step-by-step assistance
Get Started
Information Systems Control And Audit
Authors: Et Al. Hyo-Jeong Kim, Michael Mannino, Compiled By Koros Press Editorial Board
1st Edition
1781639426, 978-1781639429