

Answered step by step
Verified Expert Solution
Question
1 Approved Answer
2. The box and whisker plot below represents the scores for an exam in an 8 am section (Class A) and 10 am section
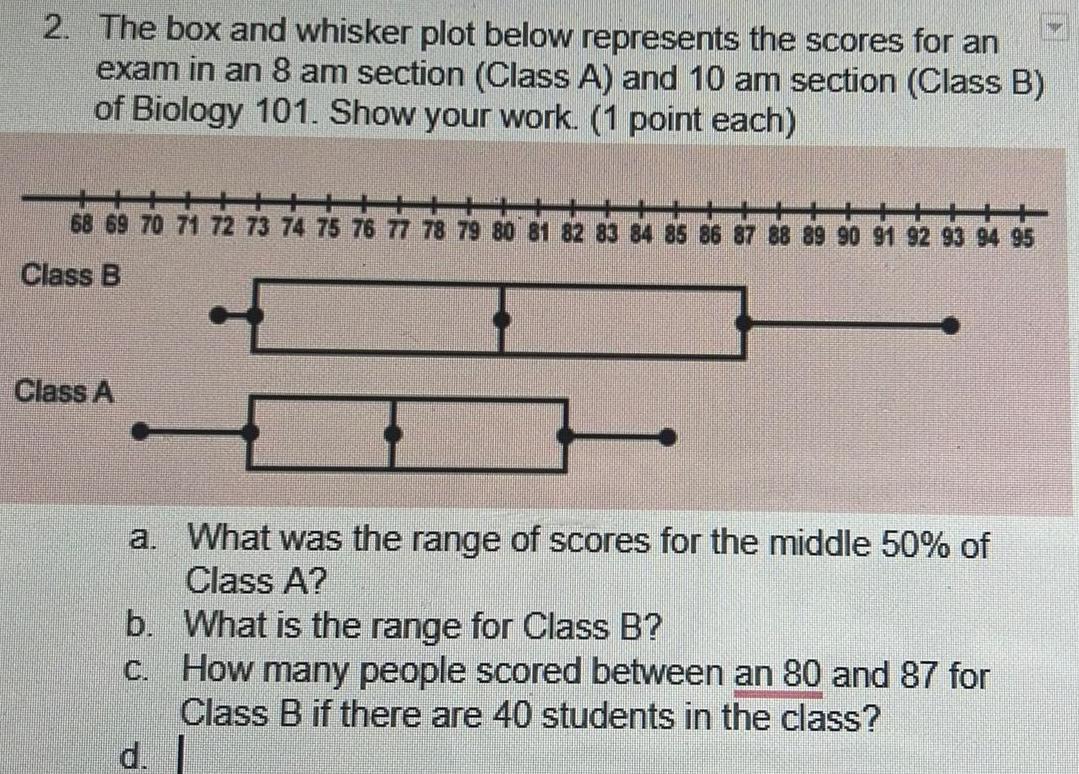
2. The box and whisker plot below represents the scores for an exam in an 8 am section (Class A) and 10 am section (Class B) of Biology 101. Show your work. (1 point each) 68 69 70 71 72 73 74 75 76 77 78 79 80 81 82 83 84 85 86 87 88 89 90 91 92 93 94 95 Class B Class A a. What was the range of scores for the middle 50% of Class A? b. What is the range for Class B? c. How many people scored between an 80 and 87 for Class B if there are 40 students in the class? d.
Step by Step Solution
There are 3 Steps involved in it
Step: 1

Get Instant Access to Expert-Tailored Solutions
See step-by-step solutions with expert insights and AI powered tools for academic success
Step: 2

Step: 3
Ace Your Homework with AI
Get the answers you need in no time with our AI-driven, step-by-step assistance
Get Started
Advanced Engineering Mathematics
Authors: Erwin Kreyszig
4th Edition
471021407, 9780471021407