Answered step by step
Verified Expert Solution
Question
1 Approved Answer
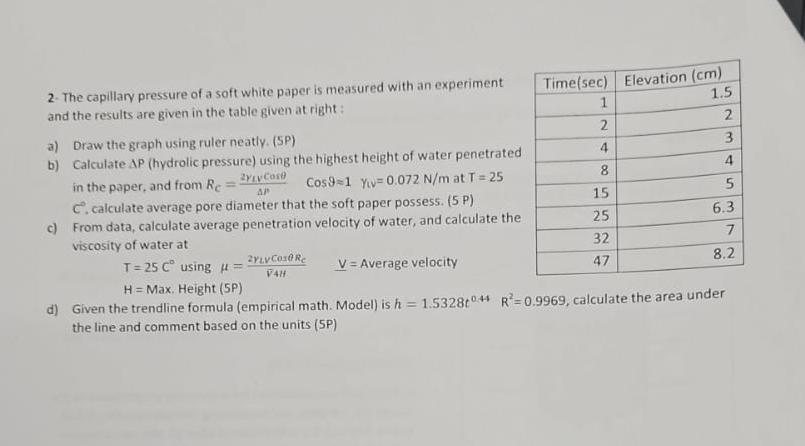
2- The capillary pressure of a soft white paper is measured with an experiment and the results are given in the table given at

2- The capillary pressure of a soft white paper is measured with an experiment and the results are given in the table given at right: Time(sec) Elevation (cm) 1.5 2 3 4 5 6.3 7 8.2 ZYLVCos0 Re VAH 1 2 4 8 15 25 32 47 a) Draw the graph using ruler neatly. (SP) b) Calculate AP (hydrolic pressure) using the highest height of water penetrated in the paper, and from Re Cos9=1 Y=0.072 N/m at T = 25 2LVCose AP C. calculate average pore diameter that the soft paper possess. (5P) c) From data, calculate average penetration velocity of water, and calculate the viscosity of water at V=Average velocity T= 25 C using #= H=Max. Height (5P) d) Given the trendline formula (empirical math. Model) is h= 1.5328t044 R=0.9969, calculate the area under the line and comment based on the units (SP)
Step by Step Solution
★★★★★
3.39 Rating (149 Votes )
There are 3 Steps involved in it
Step: 1
a Since I cannot visualize the table or draw a graph directly I will describe how you can create the ...
Get Instant Access to Expert-Tailored Solutions
See step-by-step solutions with expert insights and AI powered tools for academic success
Step: 2

Step: 3

Ace Your Homework with AI
Get the answers you need in no time with our AI-driven, step-by-step assistance
Get Started


