

Answered step by step
Verified Expert Solution
Question
1 Approved Answer
2. The diagram below presents stock price movements. By considering the binomial option pricing model, where each time step is 4 months long and the
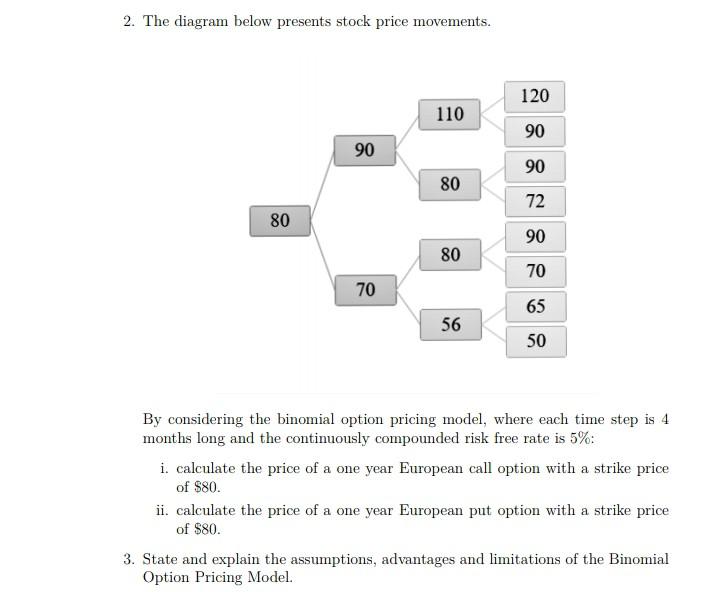
2. The diagram below presents stock price movements. By considering the binomial option pricing model, where each time step is 4 months long and the continuously compounded risk free rate is 5% : i. calculate the price of a one year European call option with a strike price of $80. ii. calculate the price of a one year European put option with a strike price of $80. 3. State and explain the assumptions, advantages and limitations of the Binomial Option Pricing Model. 2. The diagram below presents stock price movements. By considering the binomial option pricing model, where each time step is 4 months long and the continuously compounded risk free rate is 5% : i. calculate the price of a one year European call option with a strike price of $80. ii. calculate the price of a one year European put option with a strike price of $80. 3. State and explain the assumptions, advantages and limitations of the Binomial Option Pricing Model
Step by Step Solution
There are 3 Steps involved in it
Step: 1

Get Instant Access to Expert-Tailored Solutions
See step-by-step solutions with expert insights and AI powered tools for academic success
Step: 2

Step: 3
Ace Your Homework with AI
Get the answers you need in no time with our AI-driven, step-by-step assistance
Get Started
American Public School Finance
Authors: William A. Owings, Leslie S. Kaplan
1st Edition
0495807834, 9780495807834