

Answered step by step
Verified Expert Solution
Question
1 Approved Answer
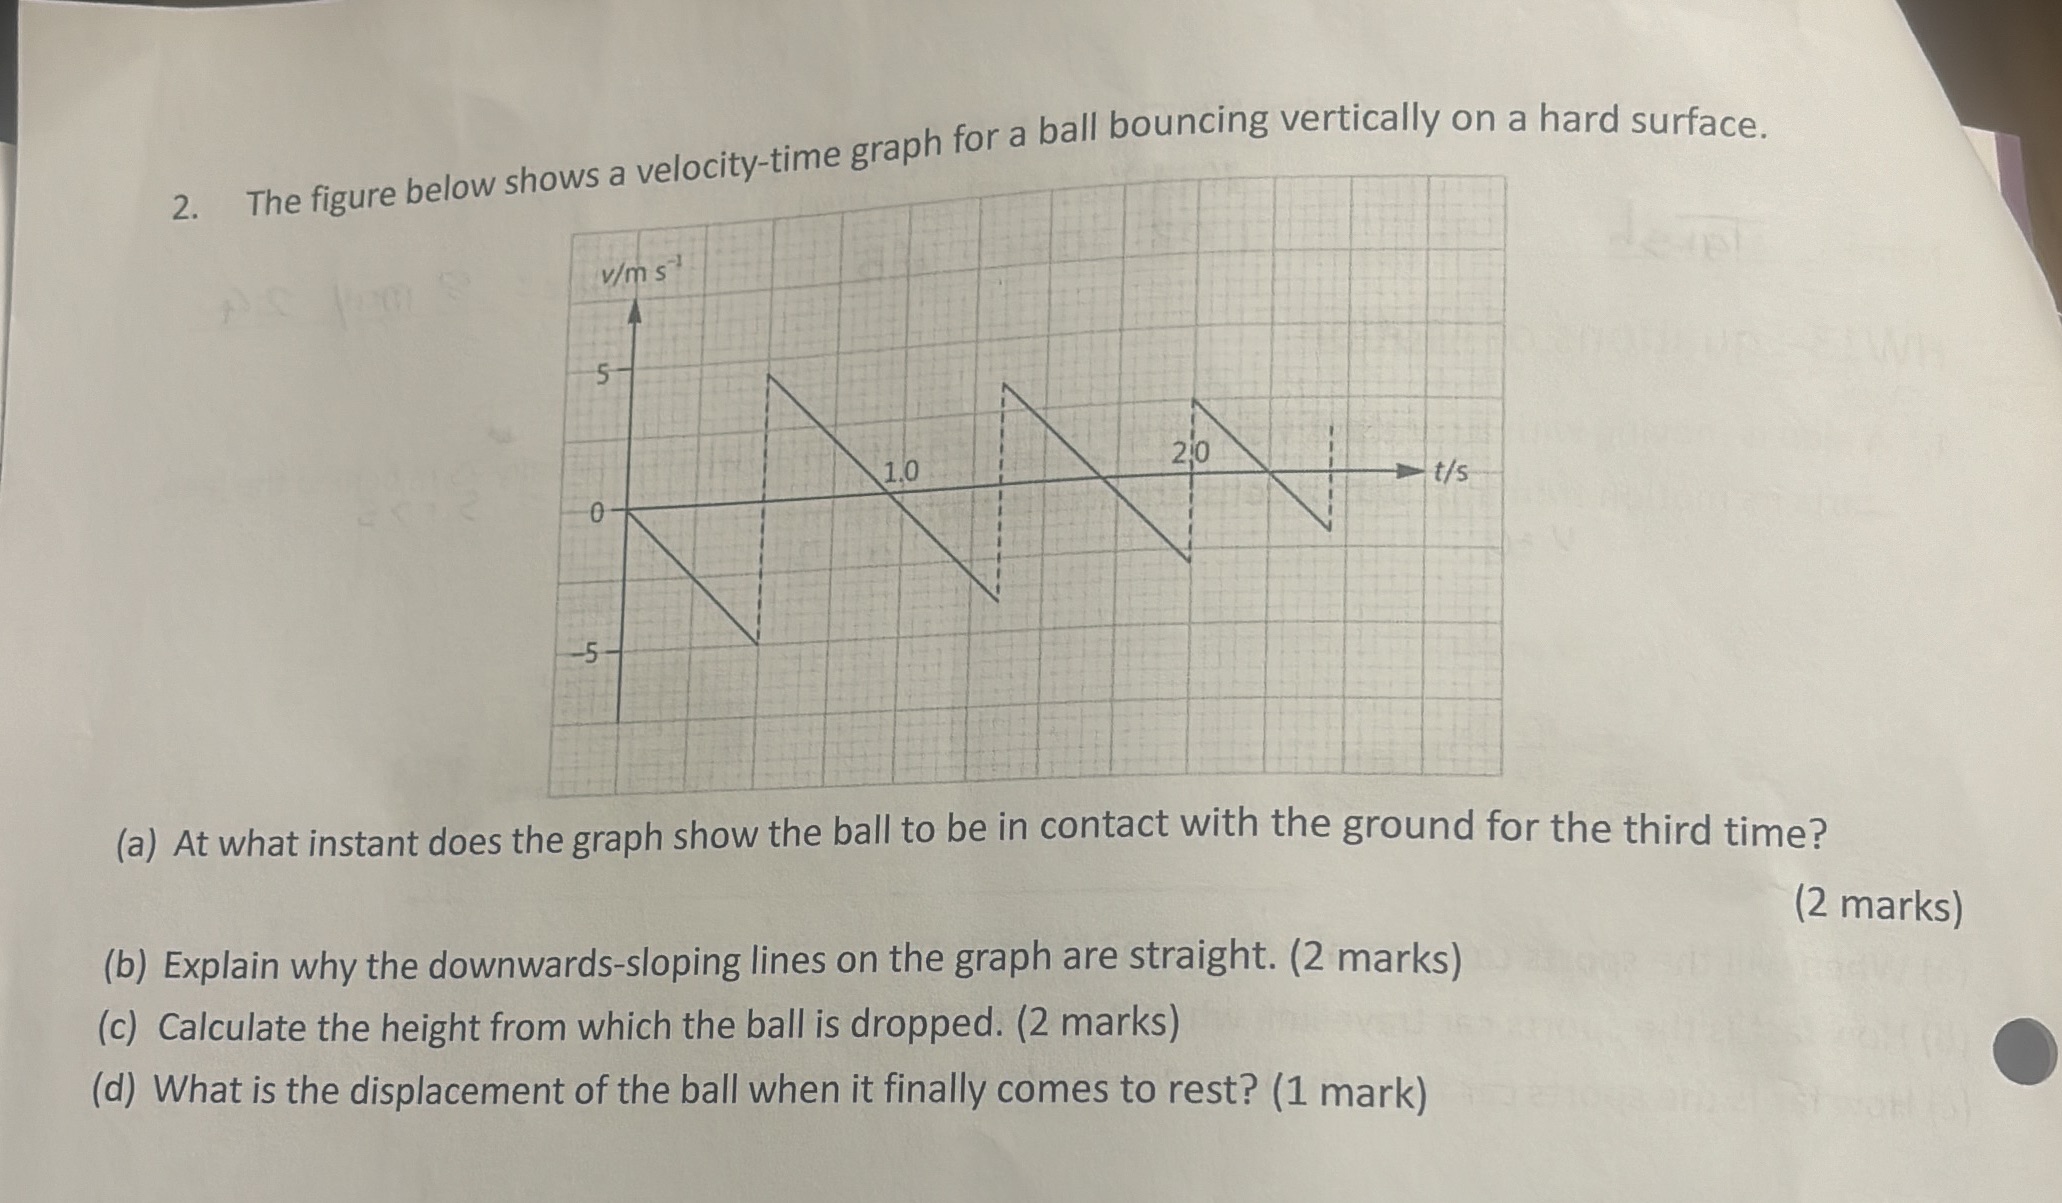
2. The figure below shows a velocity-time graph for a ball bouncing vertically on a hard surface. v/m s 5- 1,0 210 -t/s 0 (a)
Step by Step Solution
There are 3 Steps involved in it
Step: 1

Get Instant Access to Expert-Tailored Solutions
See step-by-step solutions with expert insights and AI powered tools for academic success
Step: 2

Step: 3
Ace Your Homework with AI
Get the answers you need in no time with our AI-driven, step-by-step assistance
Get Started
Infrared Technology Fundamentals
Authors: Monroe Schlessinger
2nd Edition
1351438344, 9781351438346