

Answered step by step
Verified Expert Solution
Question
1 Approved Answer
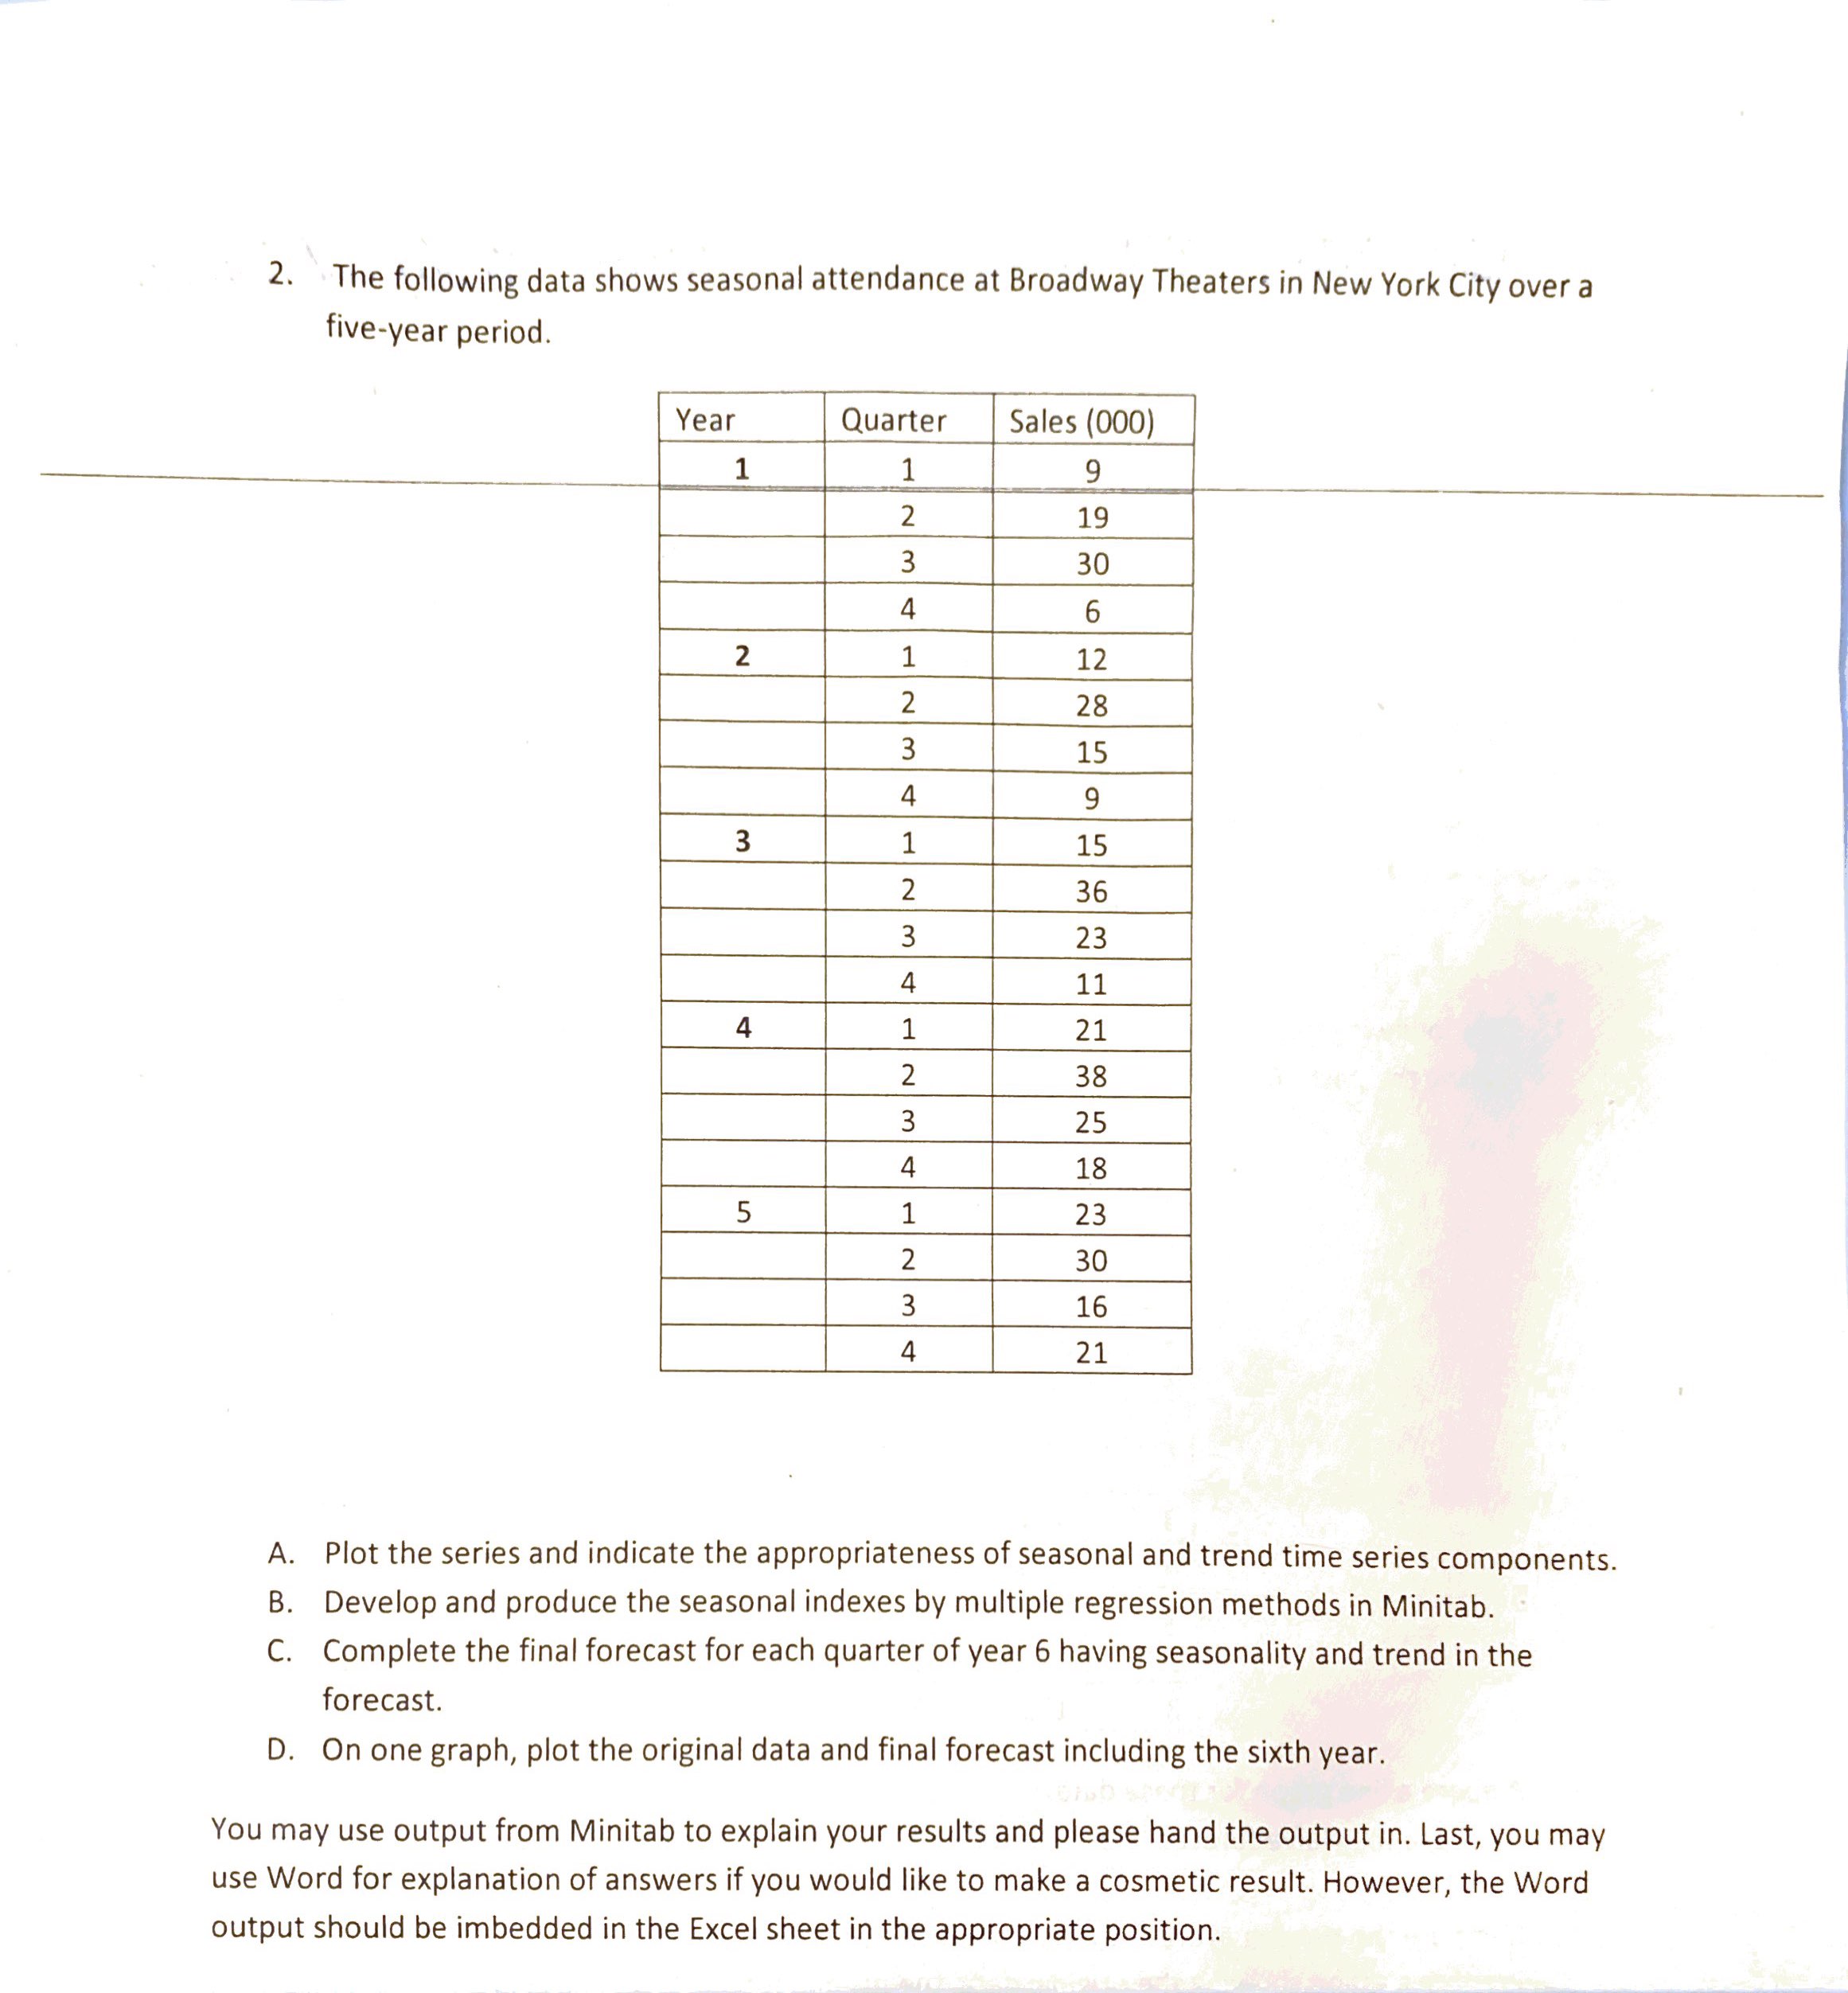
2. The following data shows seasonal attendance at Broadway Theaters in New York City over a five-year period. Sales (000) A. Plot the series and
Step by Step Solution
There are 3 Steps involved in it
Step: 1

Get Instant Access to Expert-Tailored Solutions
See step-by-step solutions with expert insights and AI powered tools for academic success
Step: 2

Step: 3
Ace Your Homework with AI
Get the answers you need in no time with our AI-driven, step-by-step assistance
Get Started
Essential Calculus Early Transcendental Functions
Authors: Ron Larson, Robert P. Hostetler, Bruce H. Edwards
1st Edition
618879188, 618879182, 978-0618879182