Answered step by step
Verified Expert Solution
Question
1 Approved Answer
2. The following table contains ten years of excess return data for the ordinary shares of company A and the market portfolio. Discuss how could
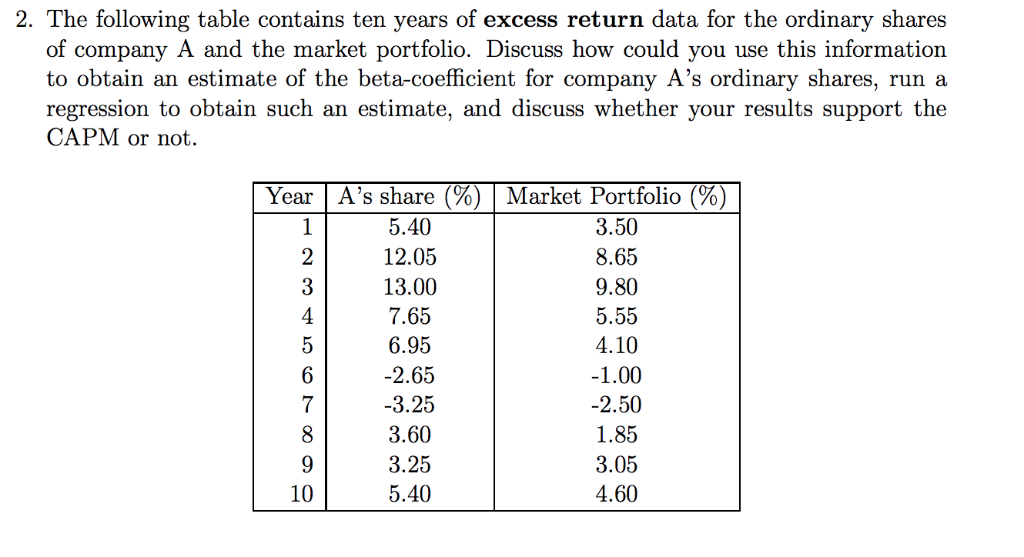
2. The following table contains ten years of excess return data for the ordinary shares of company A and the market portfolio. Discuss how could you use this information to obtain an estimate of the beta-coefficient for company A's ordinary shares, run a regression to obtain such an estimate, and discuss wheter your results support the CAPM or not. Year | A's share (%) | Market Portfolio (%) 5.40 12.05 13.00 7.65 6.95 2.65 -3.25 3.60 3.25 5.40 3.50 8.65 9.80 5.55 4.10 1.00 2.50 1.85 3.05 4.60 7 10 2. The following table contains ten years of excess return data for the ordinary shares of company A and the market portfolio. Discuss how could you use this information to obtain an estimate of the beta-coefficient for company A's ordinary shares, run a regression to obtain such an estimate, and discuss wheter your results support the CAPM or not. Year | A's share (%) | Market Portfolio (%) 5.40 12.05 13.00 7.65 6.95 2.65 -3.25 3.60 3.25 5.40 3.50 8.65 9.80 5.55 4.10 1.00 2.50 1.85 3.05 4.60 7 10
Step by Step Solution
There are 3 Steps involved in it
Step: 1
Get Instant Access to Expert-Tailored Solutions
See step-by-step solutions with expert insights and AI powered tools for academic success
Step: 2
Step: 3
Ace Your Homework with AI
Get the answers you need in no time with our AI-driven, step-by-step assistance
Get Started