Answered step by step
Verified Expert Solution
Link Copied!

Question

1 Approved Answer

2. The following table shows the market share of Electricity Inc as a percentage of the total energy production in a city by year Year
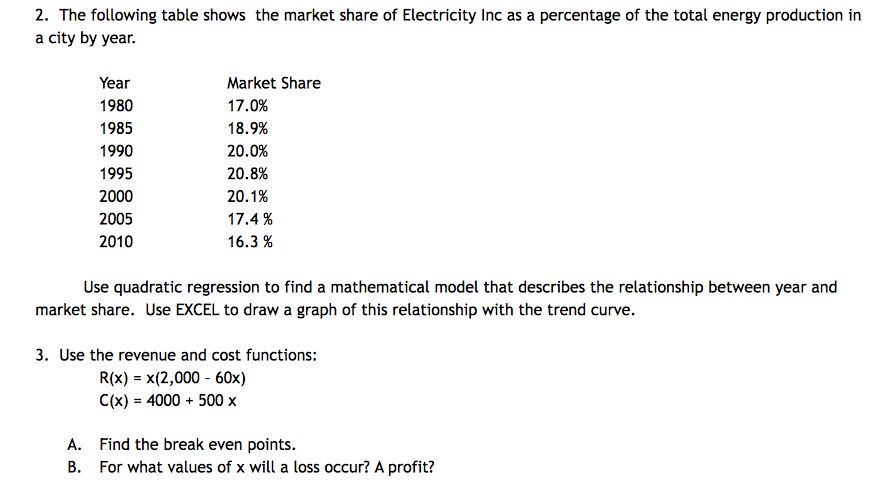
image text in transcribed

2. The following table shows the market share of Electricity Inc as a percentage of the total energy production in a city by year Year 1980 1985 1990 1995 2000 2005 2010 Market Share 17.0% 18.9% 20.0% 20.8% 20.1% 17.4 % 16.3% Use quadratic regression to find a mathematical model that describes the relationship between year and market share. Use EXCEL to draw a graph of this relationship with the trend curve 3. Use the revenue and cost functions: R(x) - x(2,000 - 60x) C(x) 4000 500x A. Find the break even points B. For what values of x will a loss occur? A profit

Step by Step Solution

There are 3 Steps involved in it

Step: 1

blur-text-image

Get Instant Access to Expert-Tailored Solutions

See step-by-step solutions with expert insights and AI powered tools for academic success

Step: 2

blur-text-image

Step: 3

blur-text-image

Ace Your Homework with AI

Get the answers you need in no time with our AI-driven, step-by-step assistance

Get Started

Recommended Textbook for

The Investment Code Ancient Jewish Wisdom For The Wise Investor

Authors: H. W. Charles

1st Edition

1533423466, 978-1533423467

More Books

Students also viewed these Finance questions

Question

=+1. What are the five general goals in delivering bad news? [LO-1]

Answered: 1 week ago