

Answered step by step
Verified Expert Solution
Question
1 Approved Answer
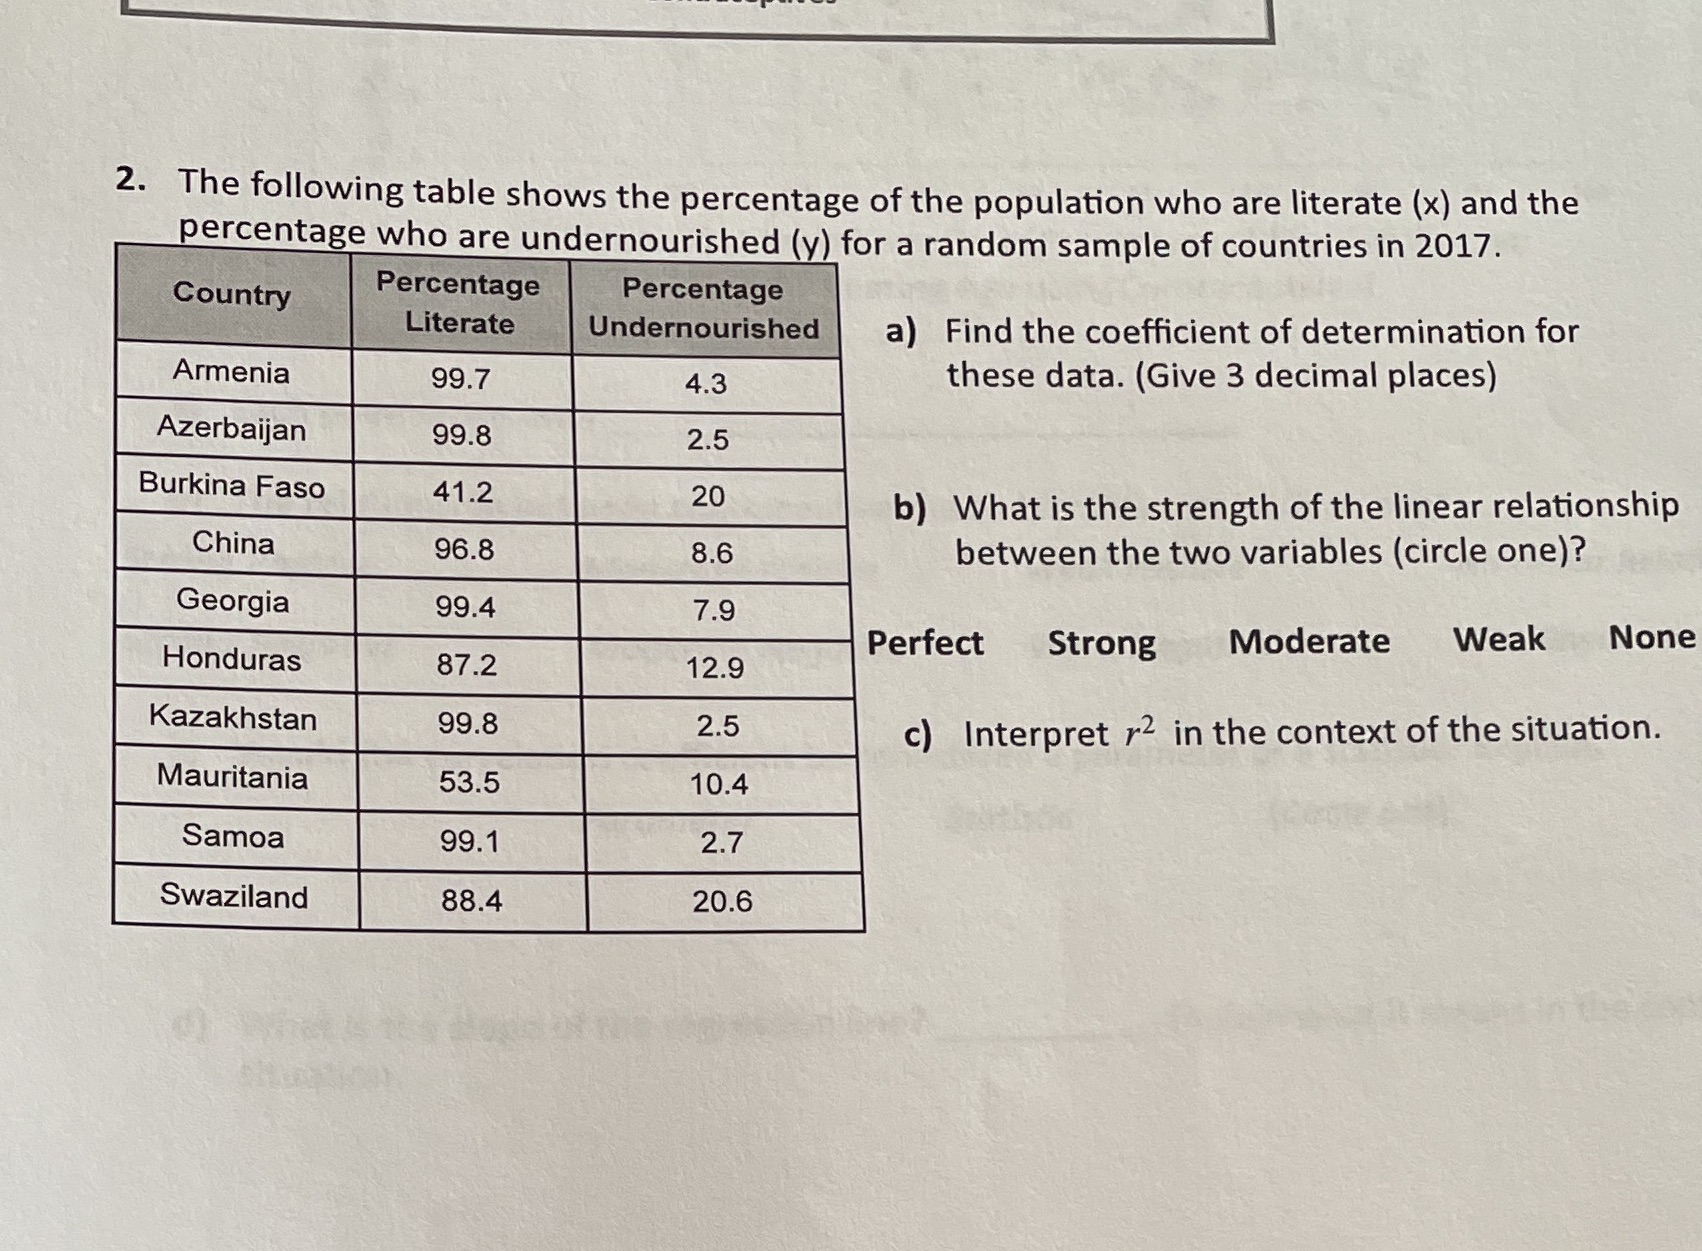
2. The following table shows the percentage of the population who are literate (x) and the percentage who are undernourished (y) for a random sample
Step by Step Solution
There are 3 Steps involved in it
Step: 1

Get Instant Access to Expert-Tailored Solutions
See step-by-step solutions with expert insights and AI powered tools for academic success
Step: 2

Step: 3
Ace Your Homework with AI
Get the answers you need in no time with our AI-driven, step-by-step assistance
Get Started
Hyers-Ulam Stability Of Ordinary Differential Equations
Authors: Arun Kumar Tripathy
1st Edition
1000386902, 9781000386905