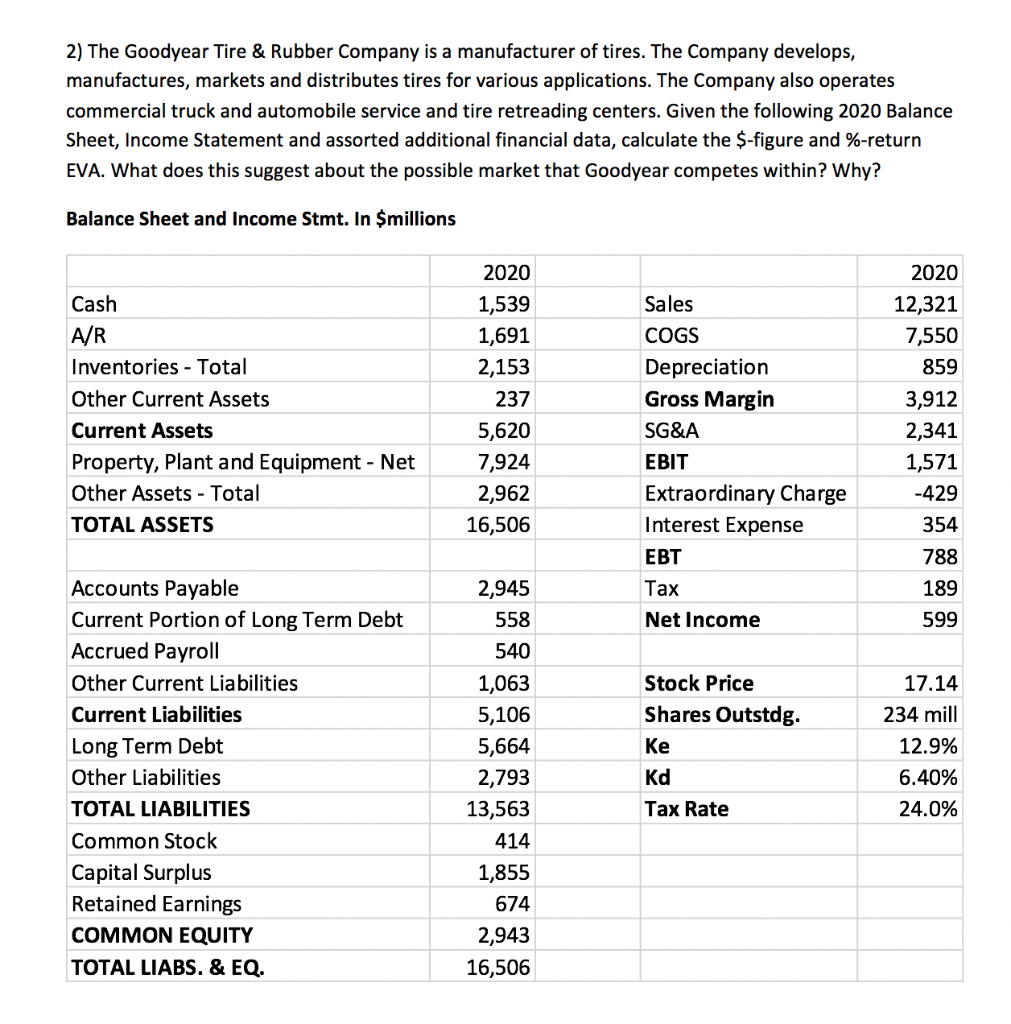
2) The Goodyear Tire & Rubber Company is a manufacturer of tires. The Company develops, manufactures, markets and distributes tires for various applications. The Company also operates commercial truck and automobile service and tire retreading centers. Given the following 2020 Balance Sheet, Income Statement and assorted additional financial data, calculate the $-figure and %-return EVA. What does this suggest about the possible market that Goodyear competes within? Why? Balance Sheet and Income Stmt. In millions Cash A/R Inventories - Total Other Current Assets Current Assets Property, Plant and Equipment - Net Other Assets - Total TOTAL ASSETS 2020 1,539 1,691 2,153 237 5,620 7,924 2,962 16,506 Sales COGS Depreciation Gross Margin SG&A EBIT Extraordinary Charge Interest Expense EBT Tax Net Income 2020 12,321 7,550 859 3,912 2,341 1,571 -429 354 788 189 599 Accounts Payable Current Portion of Long Term Debt Accrued Payroll Other Current Liabilities Current Liabilities Long Term Debt Other Liabilities TOTAL LIABILITIES Common Stock Capital Surplus Retained Earnings COMMON EQUITY TOTAL LIABS. & EQ. 2,945 558 540 1,063 5,106 5,664 2,793 13,563 414 1,855 674 2,943 16,506 Stock Price Shares Outstdg. Kd 17.14 234 mill 12.9% 6.40% 24.0% Tax Rate 2) The Goodyear Tire & Rubber Company is a manufacturer of tires. The Company develops, manufactures, markets and distributes tires for various applications. The Company also operates commercial truck and automobile service and tire retreading centers. Given the following 2020 Balance Sheet, Income Statement and assorted additional financial data, calculate the $-figure and %-return EVA. What does this suggest about the possible market that Goodyear competes within? Why? Balance Sheet and Income Stmt. In millions Cash A/R Inventories - Total Other Current Assets Current Assets Property, Plant and Equipment - Net Other Assets - Total TOTAL ASSETS 2020 1,539 1,691 2,153 237 5,620 7,924 2,962 16,506 Sales COGS Depreciation Gross Margin SG&A EBIT Extraordinary Charge Interest Expense EBT Tax Net Income 2020 12,321 7,550 859 3,912 2,341 1,571 -429 354 788 189 599 Accounts Payable Current Portion of Long Term Debt Accrued Payroll Other Current Liabilities Current Liabilities Long Term Debt Other Liabilities TOTAL LIABILITIES Common Stock Capital Surplus Retained Earnings COMMON EQUITY TOTAL LIABS. & EQ. 2,945 558 540 1,063 5,106 5,664 2,793 13,563 414 1,855 674 2,943 16,506 Stock Price Shares Outstdg. Kd 17.14 234 mill 12.9% 6.40% 24.0% Tax Rate


