Question
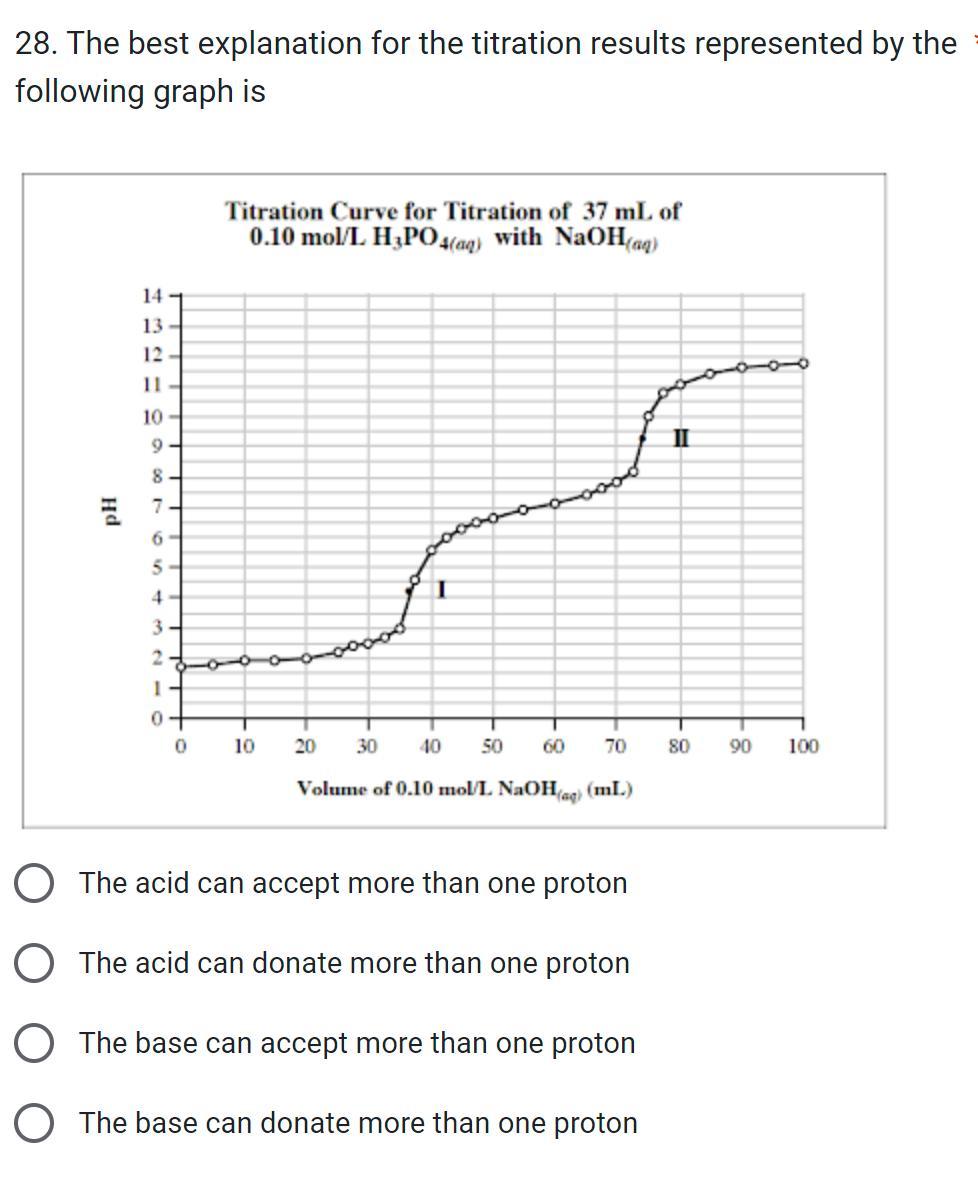
28. The best explanation for the titration results represented by the following graph is Hd 14 13 12 10 9 8 7 6 5

28. The best explanation for the titration results represented by the following graph is Hd 14 13 12 10 9 8 7 6 5 4 3 2 1 0 0 Titration Curve for Titration of 37 mL of 0.10 mol/L H3PO4(aq) with NaOH(aq) 10 20 30 40 50 60 Volume of 0.10 mol/L NaOH(aq) (mL) 70 The acid can accept more than one proton O The acid can donate more than one proton The base can accept more than one proton O The base can donate more than one proton II 80 90 100
Step by Step Solution
3.39 Rating (158 Votes )
There are 3 Steps involved in it
Step: 1
The detailed answer for the above question is provided below 1 The acid can accept more th...
Get Instant Access to Expert-Tailored Solutions
See step-by-step solutions with expert insights and AI powered tools for academic success
Step: 2

Step: 3

Ace Your Homework with AI
Get the answers you need in no time with our AI-driven, step-by-step assistance
Get StartedRecommended Textbook for
Fundamentals of Physics
Authors: Jearl Walker, Halliday Resnick
8th Extended edition
471758019, 978-0471758013
Students also viewed these Physics questions
Question
Answered: 1 week ago
Question
Answered: 1 week ago
Question
Answered: 1 week ago
Question
Answered: 1 week ago
Question
Answered: 1 week ago
Question
Answered: 1 week ago
Question
Answered: 1 week ago
Question
Answered: 1 week ago
Question
Answered: 1 week ago
Question
Answered: 1 week ago
Question
Answered: 1 week ago
Question
Answered: 1 week ago
Question
Answered: 1 week ago
Question
Answered: 1 week ago
Question
Answered: 1 week ago
Question
Answered: 1 week ago
Question
Answered: 1 week ago
Question
Answered: 1 week ago
Question
Answered: 1 week ago
Question
Answered: 1 week ago
Question
Answered: 1 week ago
Question
Answered: 1 week ago
View Answer in SolutionInn App


