

Answered step by step
Verified Expert Solution
Question
1 Approved Answer
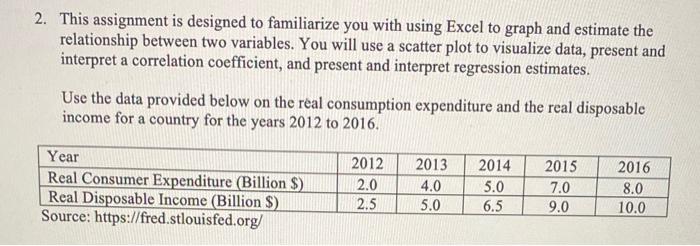
2. This assignment is designed to familiarize you with using Excel to graph and estimate the relationship between two variables. You will use a scatter
Step by Step Solution
There are 3 Steps involved in it
Step: 1

Get Instant Access to Expert-Tailored Solutions
See step-by-step solutions with expert insights and AI powered tools for academic success
Step: 2

Step: 3
Ace Your Homework with AI
Get the answers you need in no time with our AI-driven, step-by-step assistance
Get Started
Auditing A Risk Based Approach
Authors: Karla M Johnstone-Zehms, Audrey A. Gramling, Larry E. Rittenberg
12th Edition
035772187X, 978-0357721872