Answered step by step
Verified Expert Solution
Question
1 Approved Answer
2. This problem involves a MAUT assessment of local pizza joints. I don't know much about pizza in Westwood, so the scores below are


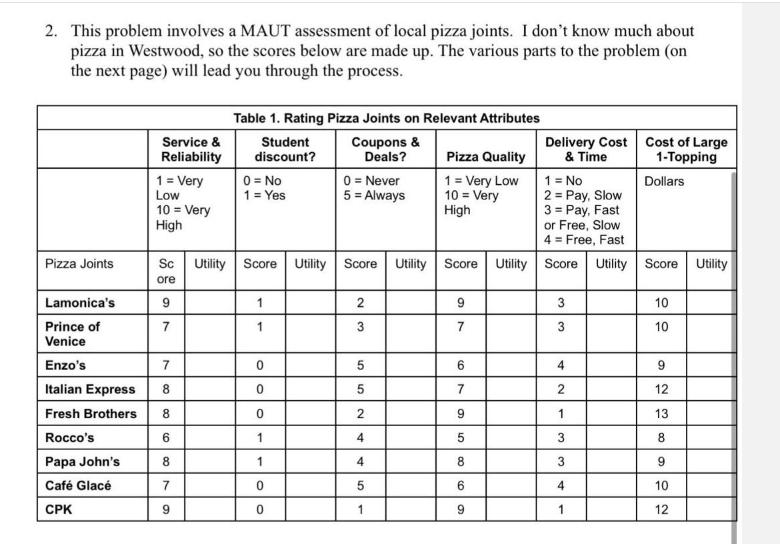
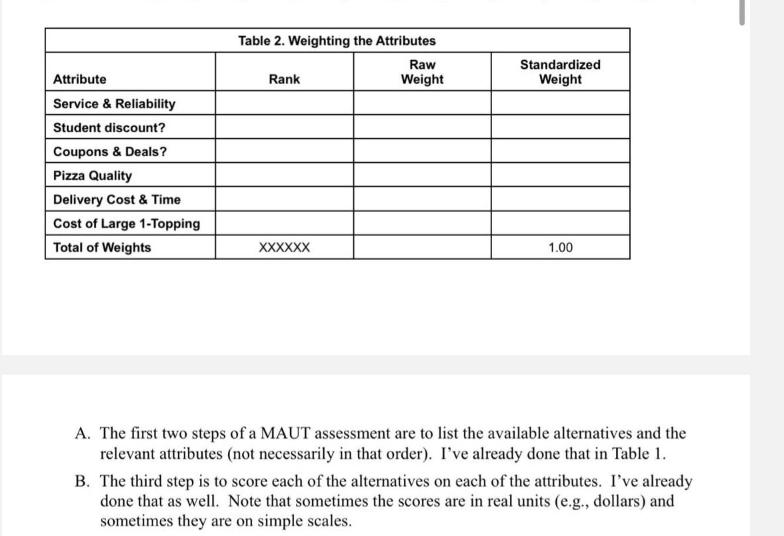
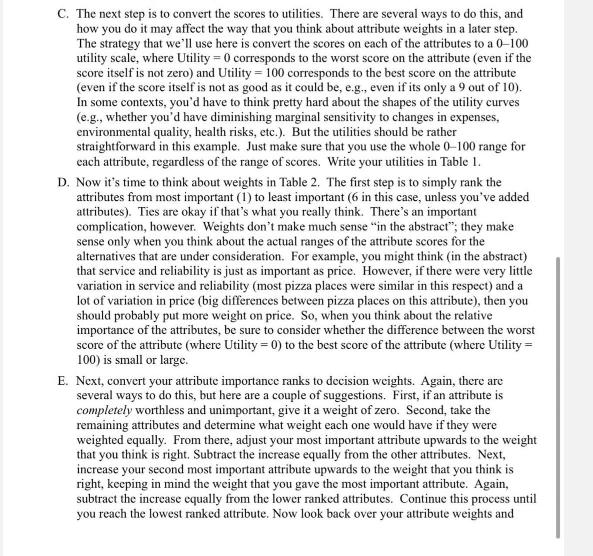
2. This problem involves a MAUT assessment of local pizza joints. I don't know much about pizza in Westwood, so the scores below are made up. The various parts to the problem (on the next page) will lead you through the process. Pizza Joints Lamonica's Prince of Venice Enzo's Italian Express Fresh Brothers Rocco's Papa John's Caf Glac CPK Service & Reliability 1 = Very Low 10 = Very High 9 7 7 8 8 6 8 7 Table 1. Rating Pizza Joints on Relevant Attributes Coupons & Deals? Sc Utility Score ore 9 Student discount? 0 = No 1 = Yes 1 1 0 0 0 1 0 0 Utility 0 = Never 5 = Always Score 2 3 5 5 2 4 4 5 1 Utility Pizza Quality 1 = Very Low 10 = Very High 1 = No 2 = Pay, Slow 3 = Pay, Fast or Free, Slow 4= Free, Fast Score Utility Score Utility 9 7 Delivery Cost & Time 6 7 9 5 8 6 9 3 3 4 2 1 3 3 4 1 Cost of Large 1-Topping Dollars Score 10 10 9 12 13 8 9 10 12 Utility Attribute Service & Reliability Student discount? Coupons & Deals? Pizza Quality Delivery Cost & Time Cost of Large 1-Topping Total of Weights Table 2. Weighting the Attributes Raw Weight Rank XXXXXX Standardized Weight 1.00 A. The first two steps of a MAUT assessment are to list the available alternatives and the relevant attributes (not necessarily in that order). I've already done that in Table 1. B. The third step is to score each of the alternatives on each of the attributes. I've already done that as well. Note that sometimes the scores are in real units (e.g., dollars) and sometimes they are on simple scales. C. The next step is to convert the scores to utilities. There are several ways to do this, and how you do it may affect the way that you think about attribute weights in a later step. The strategy that we'll use here is convert the scores on each of the attributes to a 0-100 utility scale, where Utility = 0 corresponds to the worst score on the attribute (even if the score itself is not zero) and Utility = 100 corresponds to the best score on the attribute (even if the score itself is not as good as it could be, e.g., even if its only a 9 out of 10). In some contexts, you'd have to think pretty hard about the shapes of the utility curves (e.g., whether you'd have diminishing marginal sensitivity to changes in expenses, environmental quality, health risks, etc.). But the utilities should be rather straightforward in this example. Just make sure that you use the whole 0-100 range for each attribute, regardless of the range of scores. Write your utilities in Table 1. D. Now it's time to think about weights in Table 2. The first step is to simply rank the attributes from most important (1) to least important (6 in this case, unless you've added attributes). Ties are okay if that's what you really think. There's an important complication, however. Weights don't make much sense "in the abstract"; they make sense only when you think about the actual ranges of the attribute scores for the alternatives that are under consideration. For example, you might think (in the abstract) that service and reliability is just as important as price. However, if there were very little variation in service and reliability (most pizza places were similar in this respect) and a lot of variation in price (big differences between pizza places on this attribute), then you should probably put more weight on price. So, when you think about the relative importance of the attributes, be sure to consider whether the difference between the worst score of the attribute (where Utility=0) to the best score of the attribute (where Utility = 100) is small or large. E. Next, convert your attribute importance ranks to decision weights. Again, there are several ways to do this, but here are a couple of suggestions. First, if an attribute is completely worthless and unimportant, give it a weight of zero. Second, take the remaining attributes and determine what weight each one would have if they were weighted equally. From there, adjust your most important attribute upwards to the weight that you think is right. Subtract the increase equally from the other attributes. Next, increase your second most important attribute upwards to the weight that you think is right, keeping in mind the weight that you gave the most important attribute. Again, subtract the increase equally from the lower ranked attributes. Continue this process until you reach the lowest ranked attribute. Now look back over your attribute weights and
Step by Step Solution
There are 3 Steps involved in it
Step: 1
To convert the scores to utilities we will use a 0100 scale where 0 corresponds to the worst score o...
Get Instant Access to Expert-Tailored Solutions
See step-by-step solutions with expert insights and AI powered tools for academic success
Step: 2

Step: 3

Ace Your Homework with AI
Get the answers you need in no time with our AI-driven, step-by-step assistance
Get Started


