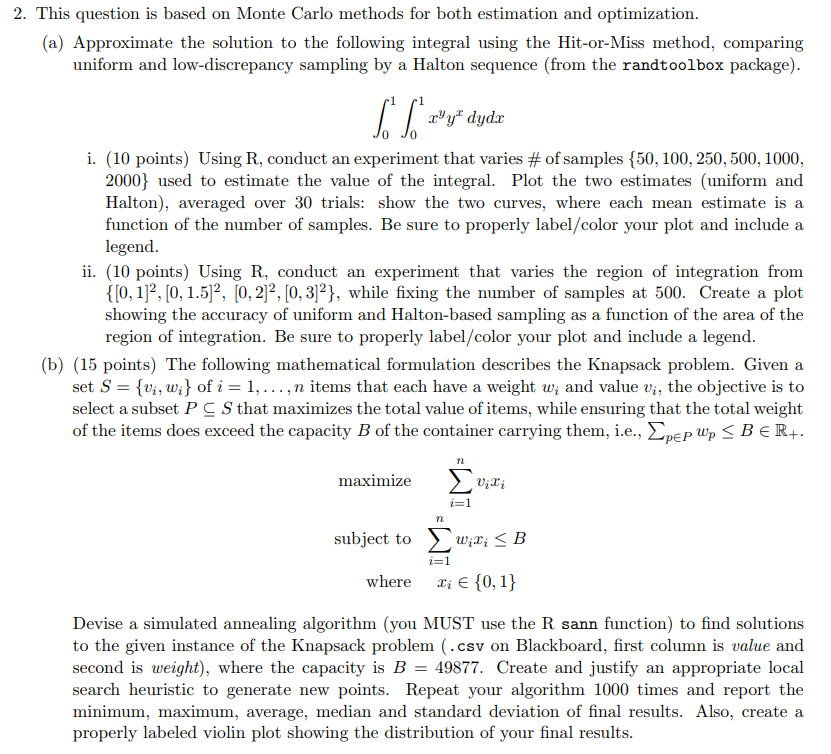
2. This question is based on Monte Carlo methods for both estimation and optimization (a) Approximate the solution to the following integral using the Hit-or-Miss method, comparing uniform and low-discrepancy sampling by a Halton sequence (from the randtoolbox package) i. (10 points) Using R, conduct an experiment that varies # of samples {50, 100, 250, 500, 1000 2000 used to estimate the value of the integral. Plot the two estimates (uniform and Halton), averaged over 30 trials: show the two curves, where each mean estimate is a function of the number of samples. Be sure to properly label/color your plot and include a legend ii. (10 points) Using R, conduct an experiment that varies the region of integration from 0, 12, 0,1.52 0,22, [0,312), while fixing the number of samples at 500. Create a plot showing the accuracy of uniform and Halton-based sampling as a function of the area of the region of integration. Be sure to properly label/color your plot and include a legend (b) (15 points) The following mathematical formulation describes the Knapsack problem. Given a set S = {vi, wi} ofi = 1, . . . ,n items that each have a weight wi and value vi, the objective is to select a subset P C S that maximizes the total value of items, while ensuring that the total weight of the items does exceed the capacity of the container carrying them. i.e., peP up B E R+. maximize UiT l. subject to ,wai B where xi E 0, 1) Devise a simulated annealing algorithm (you MUST use the R sann function) to find solutions to the given instance of the Knapsack problem (.csv on Blackboard, first column is value and second is weight), where the capacity is B 49877. Create and justify an appropriate local search heuristic to generate new points. Repeat your algorithm 1000 times and report the minimum, maximum, average, median and standard deviation of final results. Also, create a properly labeled violin plot showing the distribution of your final results 2. This question is based on Monte Carlo methods for both estimation and optimization (a) Approximate the solution to the following integral using the Hit-or-Miss method, comparing uniform and low-discrepancy sampling by a Halton sequence (from the randtoolbox package) i. (10 points) Using R, conduct an experiment that varies # of samples {50, 100, 250, 500, 1000 2000 used to estimate the value of the integral. Plot the two estimates (uniform and Halton), averaged over 30 trials: show the two curves, where each mean estimate is a function of the number of samples. Be sure to properly label/color your plot and include a legend ii. (10 points) Using R, conduct an experiment that varies the region of integration from 0, 12, 0,1.52 0,22, [0,312), while fixing the number of samples at 500. Create a plot showing the accuracy of uniform and Halton-based sampling as a function of the area of the region of integration. Be sure to properly label/color your plot and include a legend (b) (15 points) The following mathematical formulation describes the Knapsack problem. Given a set S = {vi, wi} ofi = 1, . . . ,n items that each have a weight wi and value vi, the objective is to select a subset P C S that maximizes the total value of items, while ensuring that the total weight of the items does exceed the capacity of the container carrying them. i.e., peP up B E R+. maximize UiT l. subject to ,wai B where xi E 0, 1) Devise a simulated annealing algorithm (you MUST use the R sann function) to find solutions to the given instance of the Knapsack problem (.csv on Blackboard, first column is value and second is weight), where the capacity is B 49877. Create and justify an appropriate local search heuristic to generate new points. Repeat your algorithm 1000 times and report the minimum, maximum, average, median and standard deviation of final results. Also, create a properly labeled violin plot showing the distribution of your final results