Answered step by step
Verified Expert Solution
Question
1 Approved Answer
2. To assess the materiality of the company's passive investments (both debt and equity), calculate the company's passive investments (including cash and cash equivalents)
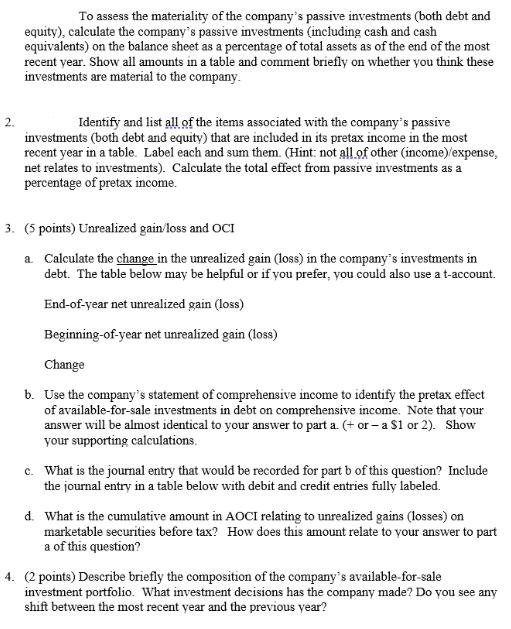
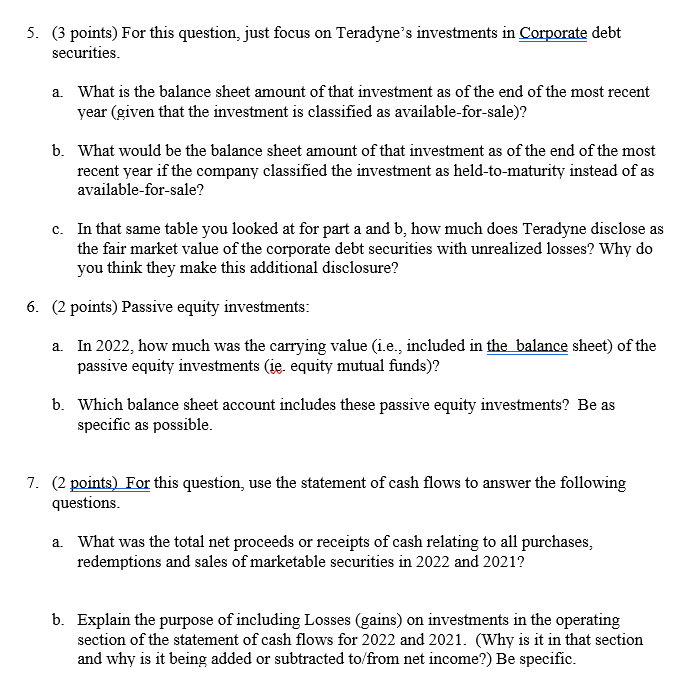
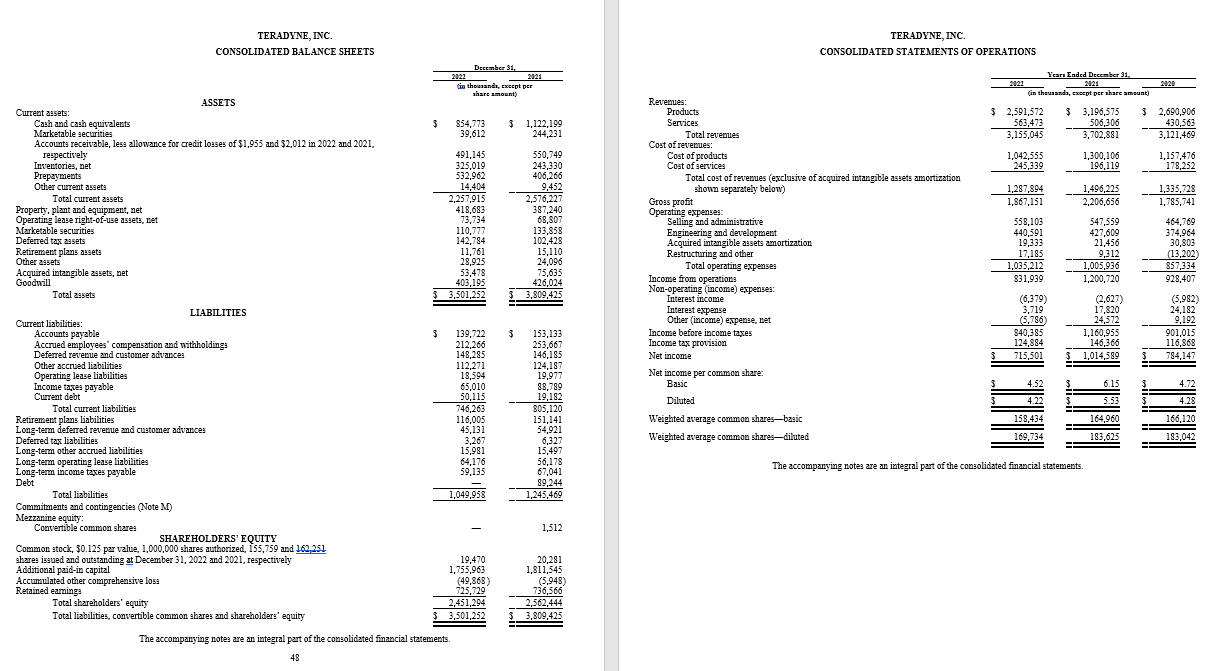
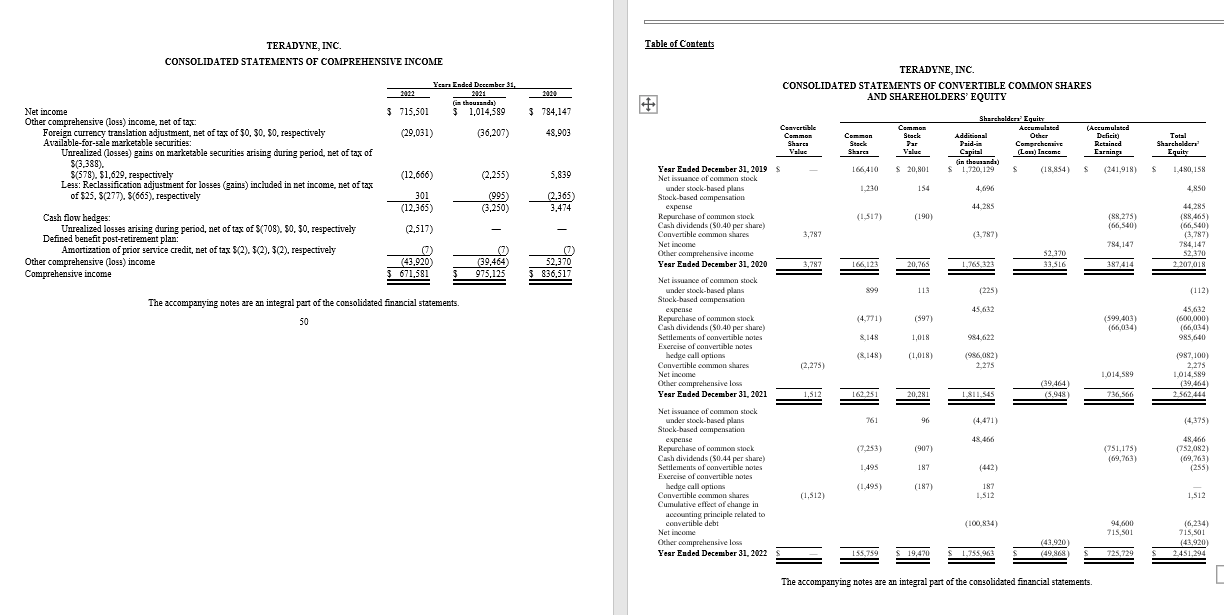
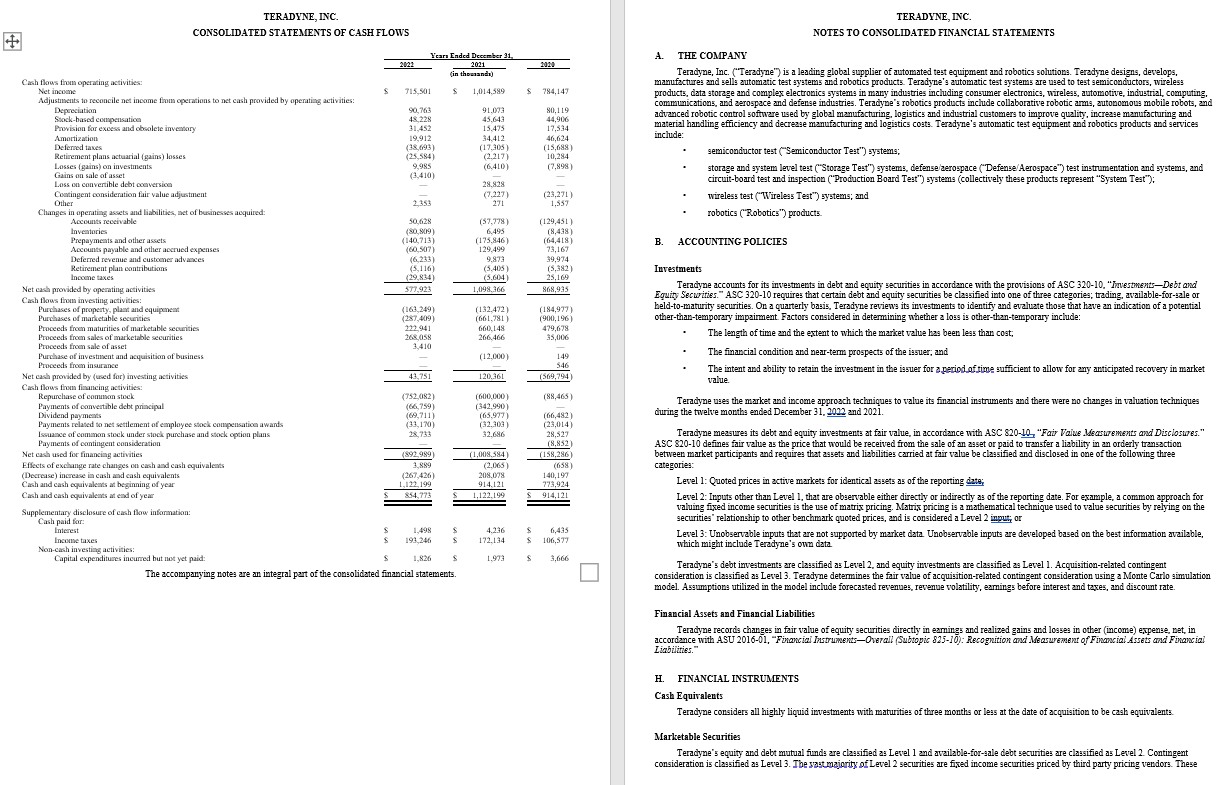
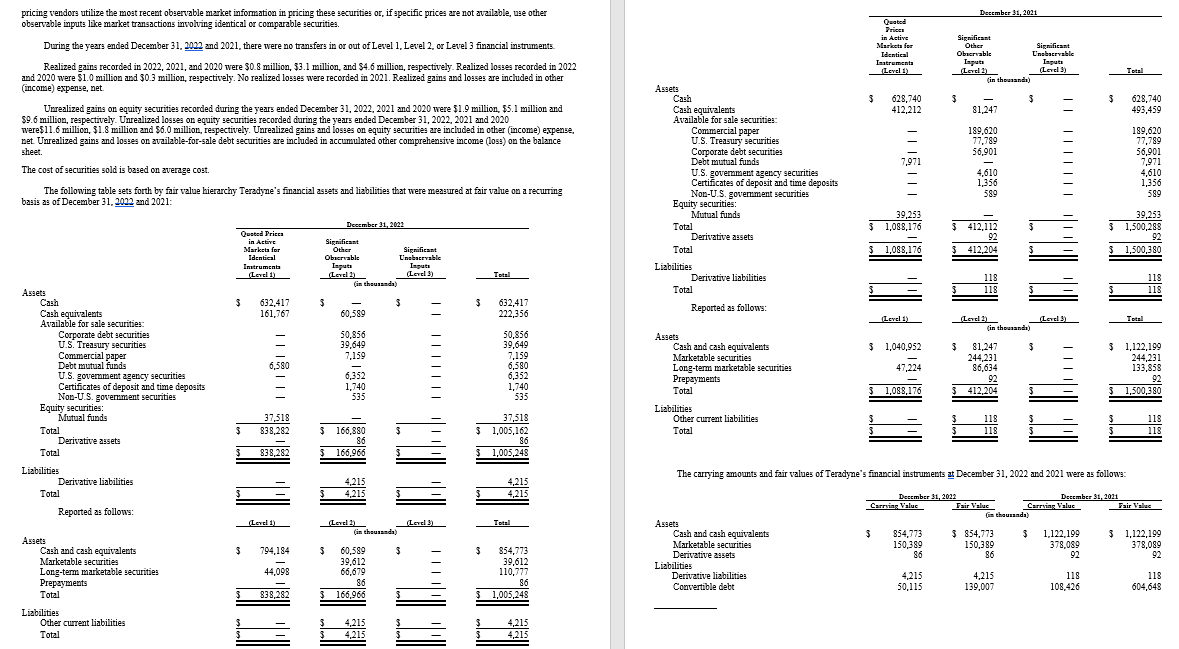
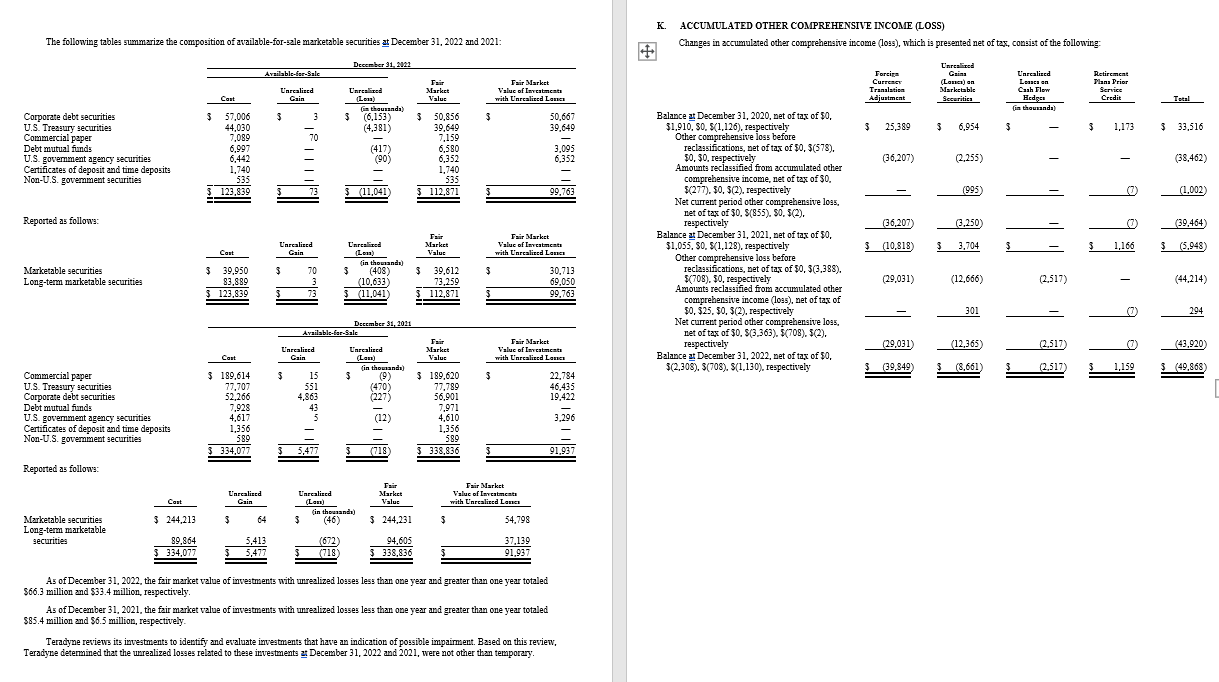
2. To assess the materiality of the company's passive investments (both debt and equity), calculate the company's passive investments (including cash and cash equivalents) on the balance sheet as a percentage of total assets as of the end of the most recent year. Show all amounts in a table and comment briefly on whether you think these investments are material to the company. Identify and list all of the items associated with the company's passive investments (both debt and equity) that are included in its pretax income in the most recent year in a table. Label each and sum them. (Hint: not all of other (income)/expense, net relates to investments). Calculate the total effect from passive investments as a percentage of pretax income. 3. (5 points) Unrealized gain/loss and OCI a. Calculate the change in the unrealized gain (loss) in the company's investments in debt. The table below may be helpful or if you prefer, you could also use a t-account. End-of-year net unrealized gain (loss) Beginning-of-year net unrealized gain (loss) Change b. Use the company's statement of comprehensive income to identify the pretax effect of available-for-sale investments in debt on comprehensive income. Note that your answer will be almost identical to your answer to part a. (+ or -a $1 or 2). Show your supporting calculations. c. What is the journal entry that would be recorded for part b of this question? Include the journal entry in a table below with debit and credit entries fully labeled. d. What is the cumulative amount in AOCI relating to unrealized gains (losses) on marketable securities before tax? How does this amount relate to your answer to part a of this question? 4. (2 points) Describe briefly the composition of the company's available-for-sale investment portfolio. What investment decisions has the company made? Do you see any shift between the most recent year and the previous year? 5. (3 points) For this question, just focus on Teradyne's investments in Corporate debt securities. a. What is the balance sheet amount of that investment as of the end of the most recent year (given that the investment is classified as available-for-sale)? b. What would be the balance sheet amount of that investment as of the end of the most recent year if the company classified the investment as held-to-maturity instead of as available-for-sale? c. In that same table you looked at for part a and b, how much does Teradyne disclose as the fair market value of the corporate debt securities with unrealized losses? Why do you think they make this additional disclosure? 6. (2 points) Passive equity investments: a. In 2022, how much was the carrying value (i.e., included in the balance sheet) of the passive equity investments (ie. equity mutual funds)? b. Which balance sheet account includes these passive equity investments? Be as specific as possible. 7. (2 points) For this question, use the statement of cash flows to answer the following questions. a. What was the total net proceeds or receipts of cash relating to all purchases, redemptions and sales of marketable securities in 2022 and 2021? b. Explain the purpose of including Losses (gains) on investments in the operating section of the statement of cash flows for 2022 and 2021. (Why is it in that section and why is it being added or subtracted to/from net income?) Be specific. TERADYNE, INC. CONSOLIDATED BALANCE SHEETS December 31, 2022 2021 in thousands, except per share amount) TERADYNE, INC. CONSOLIDATED STATEMENTS OF OPERATIONS 2022 Years Ended December 31, 2021 (in thousands, except per share amount) 2020 ASSETS Current assets: Cash and cash equivalents Marketable securities Accounts receivable, less allowance for credit losses of $1,955 and $2,012 in 2022 and 2021. $ 854,773 39,612 $ 1,122,199 244,231 Revenues: Products Services $ 2,591,572 $ 3,196,575 $ 2,690,906 563,473 506,306 430,563 Total revenues 3,155,045 3,702,881 3,121,469 Cost of revenues: respectively Inventories, net Prepayments 491,145 550,749 Cost of products 1,042,555 1,300,106 1,157,476 325,019 243,330 Cost of services 245,339 196,119 178,252 532,962 406,266 Total cost of revenues (exclusive of acquired intangible assets amortization Other current assets Total current assets Property, plant and equipment, net Operating lease right-of-use assets, net Marketable securities Deferred tax assets Retirement plans assets Other assets Acquired intangible assets, net Goodwill Total assets 14,404 9,452 shown separately below) 1,287,894 2,257,915 418,683 2,576,227 387,240 Gross profit 1,867,151 1,496,225 2,206,656 1,335,728 1,785,741 Operating expenses: 73,734 68,807 Selling and administrative 558,103 547,559 110,777 133,858 Engineering and development 440,591 427,609 142,784 102,428 Acquired intangible assets amortization 19,333 21,456 11,761 15,110 Restructuring and other 17,185 28,925 24,096 53,478 75,635 Total operating expenses 1,035,212 9,312 1,005,936 403,195 426,024 Income from operations 831,939 1,200,720 $ 3,501,252 3,809,425 Non-operating (income) expenses: Interest income (6,379) (2,627) LIABILITIES Interest expense 3,719 17,820 Current liabilities: Accounts payable Accrued employees' compensation and withholdings Deferred revenue and customer advances Other accrued liabilities Operating lease liabilities Income taxes payable Current debt Total current liabilities Retirement plans liabilities Long-term deferred revenue and customer advances Deferred tax liabilities Long-term other accrued liabilities Long-term operating lease liabilities Long-term income taxes payable Debt Total liabilities Commitments and contingencies (Note M) Other (income) expense, net (5,786) 24,572 $ 139,722 $ 153,133 Income before income taxes 840,385 1,160,955 212,266 253,667 Income tax provision 124,884 146,366 148,285 146,185 112,271 124,187 18,594 19,977 65,010 88,789 50,115 19,182 Net income Net income per common share: Basic Diluted 715,501 $ 1,014,589 4.52 4.22 6.15 464,769 374,964 30,803 (13,202) 857,334 928,407 (5,982) 24,182 901,015 116,868 784,147 5.53 746,263 805,120 116,005 151,141 Weighted average common shares-basic 158,434 164,960 166,120 45,131 54,921 3,267 6,327 Weighted average common shares-diluted 169,734 183,625 183,042 15,981 15,497 64,176 56,178 59,135 67,041 The accompanying notes are an integral part of the consolidated financial statements. 89,244 1,049,958 1,245,469 Mezzanine equity: Convertible common shares SHAREHOLDERS' EQUITY Common stock, $0.125 par value, 1,000,000 shares authorized, 155,759 and 162,251 shares issued and outstanding at December 31, 2022 and 2021, respectively Additional paid-in capital Accumulated other comprehensive loss Retained earnings Total shareholders' equity Total liabilities, convertible common shares and shareholders' equity 1,512 19,470 20,281 1,755,963 1,811,545 (49,868) 725,729 2,451,294 $ 3,501,252 (5,948) 736,566 2,562,444 $ 3,809,425 The accompanying notes are an integral part of the consolidated financial statements. 48 TERADYNE, INC. CONSOLIDATED STATEMENTS OF COMPREHENSIVE INCOME Table of Contents Years Ended December 31, 2012 2021 2020 Net income Other comprehensive (loss) income, net of tax: $ 715,501 (in thousands) $ 1,014,589 $ 784,147 4 TERADYNE, INC. CONSOLIDATED STATEMENTS OF CONVERTIBLE COMMON SHARES AND SHAREHOLDERS' EQUITY Foreign currency translation adjustment, net of tax of $0, $0, $0, respectively Available-for-sale marketable securities: (29,031) (36,207) 48,903 Convertible Common Sharca Commen Stock Commen Stock Far Additional Paid-in Unrealized (losses) gains on marketable securities arising during period, net of tax of $(3,388). Value Value Capital Shareholders' Equity Accumulated Other Comprehensive (Lan) Income (Accumulated Deficit) Total Retained Earnings Shareholders Equity (in thousands) Year Ended December 31, 2019 S 166,410 $ 20,801 $ 1,720,129 $ (18,854) $ (241,918) $ 1,480,158 $(578). $1,629, respectively (12,666) (2,255) 5,839 Net issuance of common stock Less: Reclassification adjustment for losses (gains) included in net income, net of tax of $25, $(277), $(665), respectively 301 (995) (12,365) (3,250) (2,365) 3,474 under stock-based plans Stock-based compensation expense 1,230 154 4,696 4,850 44,285 44,285 Cash flow hedges: Unrealized losses arising during period, net of tax of $(708). $0, $0, respectively Defined benefit post-retirement plan: (2,517) Repurchase of common stock Cash dividends (50.40 per share) (1,517) (190) (88,275) (88,465) (66,540) (66,540) Convertible common shares Net income 3,787 (3,787) (3,787) 784,147 784,147 Amortization of prior service credit, net of tax $(2), $(2), $(2), respectively Other comprehensive income Other comprehensive (loss) income (43,920) Comprehensive income $ 671,581 (39,464) 975,125 52,370 Year Ended December 31, 2020 166,123 20,765 1,765,323 52,370 33,516 52,370 387,414 2,207,018 $ 836,517 The accompanying notes are an integral part of the consolidated financial statements. 50 Net issuance of common stock under stock-based plans Stock-based compensation expense Repurchase of common stock. Cash dividends (50.40 per share) Settlements of convertible notes Exercise of convertible notes hedge call options Convertible common shares Net income 899 113 (225) (112) 45,632 45,632 (4,771) (597) (599,403) (66,034) (600,000) (66,034) 8,148 1,018 984,622 985,640 (8,148) (1,018) (2,275) (986,082) 2,275 (987,100) 2,275 1,014,589 1,014,589 Other comprehensive loss Year Ended December 31, 2021 1,512 162,251 20,281 1,811,545 (39,464) (5,948) (39,464) 736,566 2,562,444 Net issuance of common stock under stock-based plans Stock-based compensation expense Repurchase of common stock Cash dividends (50.44 per share) Settlements of convertible notes Exercise of convertible notes hedge call options Convertible common shares Cumulative effect of change in 761 96 (4,471) 48,466 (7,253) 1,495 (1,495) (907) 187 (442) (187) (1,512) 187 1,512 accounting principle related to convertible debt Net income Other comprehensive loss Year Ended December 31, 2022 155,759 $ 19,470 $ 1,755,963 (4,375) (751,175) (69,763) 48,466 (752,082) (69,763) (255) 1,512 (100,834) 94,600 (6,234) 715,501 715,501 (43,920) (43,920) (49,868) 725,729 2,451,294 The accompanying notes are an integral part of the consolidated financial statements. + TERADYNE, INC. CONSOLIDATED STATEMENTS OF CASH FLOWS 2021 Years Ended December 31, 2021 (in thousands) Cash flows from operating activities: Net income Adjustments to reconcile net income from operations to net cash provided by operating activities: Depreciation Stock-based compensation Provision for excess and obsolete inventory Amortization Deferred taxes Retirement plans actuarial (gains) losses Losses (gains) on investments Gains on sale of asset Loss on convertible debt conversion Contingent consideration fair value adjustment Other Changes in operating assets and liabilities, net of businesses acquired: Accounts receivable Inventories Prepayments and other assets Accounts payable and other accrued expenses Deferred revenue and customer advances Retirement plan contributions Income taxes Net cash provided by operating activities Cash flows from investing activities: Purchases of property, plant and equipment Purchases of marketable securities Proceeds from maturities of marketable securities Proceeds from sales of marketable securities Proceeds from sale of asset Purchase of investment and acquisition of business Proceeds from insurance Net cash provided by (used for) investing activities Cash flows from financing activities: Repurchase of common stock Payments of convertible debt principal Dividend payments Payments related to net settlement of employee stock compensation awards Issuance of common stock under stock purchase and stock option plans Payments of contingent consideration Net cash used for financing activities Effects of exchange rate changes on cash and cash equivalents (Decrease) increase in cash and cash equivalents Cash and cash equivalents at beginning of year Cash and cash equivalents at end of year Supplementary disclosure of cash flow information: Cash paid for: Interest Income taxes Non-cash investing activities: $ 715,501 $ 90,763 48,228 31,452 19,912 (38,693) (25,584) 9,985 (3,410) 2,353 50,628 (80,809) (140,713) (60,507) (6,233) (5,116) (29,834) 577,923 (163,249) (287,409) 222,941 268,058 3,410 43,751 (752,082) (66,759) (69,711) (33,170) 28,733 (892,989) 3,889 (267,426) 1,122,199 854,773 $ 1,498 $ 4,236 $ 6,435 193,246 $ 172,134 Capital expenditures incurred but not yet paid: $ 1,826 $ 1,973 $ 3,666 The accompanying notes are an integral part of the consolidated financial statements. A. THE COMPANY TERADYNE, INC. NOTES TO CONSOLIDATED FINANCIAL STATEMENTS $ 784,147 80,119 44,906 17,534 46,624 (15,688) 10,284 (7,898) (23,271) 1,557 (129,451) (8,438) (64,418) 73,167 39,974 (5,382) 25,169 868,935 (184,977) (900,196) 479,678 35,006 149 546 (569,794) (88,465) (66,482) (23,014) 28,527 (8,852) (158,286) (658) 140,197 773,924 914,121 $ 106,577 Teradyne, Inc. ("Teradyne") is a leading global supplier of automated test equipment and robotics solutions. Teradyne designs, develops, manufactures and sells automatic test systems and robotics products. Teradyne's automatic test systems are used to test semiconductors, wireless products, data storage and complex electronics systems in many industries including consumer electronics, wireless, automotive, industrial, computing, communications, and aerospace and defense industries. Teradyne's robotics products include collaborative robotic arms, autonomous mobile robots, and advanced robotic control software used by global manufacturing, logistics and industrial customers to improve quality, increase manufacturing and material handling efficiency and decrease manufacturing and logistics costs. Teradyne's automatic test equipment and robotics products and services include: semiconductor test ("Semiconductor Test") systems; storage and system level test ("Storage Test") systems, defense/aerospace ("Defense/Aerospace") test instrumentation and systems, and circuit-board test and inspection ("Production Board Test") systems (collectively these products represent "System Test"); wireless test ("Wireless Test") systems; and robotics ("Robotics") products. B. ACCOUNTING POLICIES Investments Teradyne accounts for its investments in debt and equity securities in accordance with the provisions of ASC 320-10. "Investments-Debt and Equity Securities." ASC 320-10 requires that certain debt and equity securities be classified into one of three categories; trading, available-for-sale or held-to-maturity securities. On a quarterly basis, Teradyne reviews its investments to identify and evaluate those that have an indication of a potential other-than-temporary impairment. Factors considered in determining whether a loss is other-than-temporary include: The length of time and the extent to which the market value has been less than cost; The financial condition and near-term prospects of the issuer; and The intent and ability to retain the investment in the issuer for a period of time sufficient to allow for any anticipated recovery in market value. Teradyne uses the market and income approach techniques to value its financial instruments and there were no changes in valuation techniques during the twelve months ended December 31, 2022 and 2021. Teradyne measures its debt and equity investments at fair value, in accordance with ASC 820-10, "Fair Value Measurements and Disclosures." ASC 820-10 defines fair value as the price that would be received from the sale of an asset or paid to transfer a liability in an orderly transaction between market participants and requires that assets and liabilities carried at fair value be classified and disclosed in one of the following three categories: Level 1: Quoted prices in active markets for identical assets as of the reporting date; Level 2: Inputs other than Level 1, that are observable either directly or indirectly as of the reporting date. For example, a common approach for valuing fixed income securities is the use of matrix pricing. Matrix pricing is a mathematical technique used to value securities by relying on the securities' relationship to other benchmark quoted prices, and is considered a Level 2 input; or Level 3: Unobservable inputs that are not supported by market data. Unobservable inputs are developed based on the best information available, which might include Teradyne's own data. Teradyne's debt investments are classified as Level 2, and equity investments are classified as Level 1. Acquisition-related contingent consideration is classified as Level 3. Teradyne determines the fair value of acquisition-related contingent consideration using a Monte Carlo simulation model. Assumptions utilized in the model include forecasted revenues, revenue volatility, earnings before interest and taxes, and discount rate. Financial Assets and Financial Liabilities Teradyne records changes in fair value of equity securities directly in earnings and realized gains and losses in other (income) expense, net, in accordance with ASU 2016-01, "Financial Instruments-Overall (Subtopic 825-10): Recognition and Measurement of Financial Assets and Financial Liabilities." H. FINANCIAL INSTRUMENTS Cash Equivalents Teradyne considers all highly liquid investments with maturities of three months or less at the date of acquisition to be cash equivalents. Marketable Securities Teradyne's equity and debt mutual funds are classified as Level 1 and available-for-sale debt securities are classified as Level 2. Contingent consideration is classified as Level 3. The vast majority of Level 2 securities are fixed income securities priced by third party pricing vendors. These pricing vendors utilize the most recent observable market information in pricing these securities or, if specific prices are not available, use other observable inputs like market transactions involving identical or comparable securities. During the years ended December 31, 2022 and 2021, there were no transfers in or out of Level 1, Level 2, or Level 3 financial instruments. Realized gains recorded in 2022, 2021, and 2020 were $0.8 million, $3.1 million, and $4.6 million, respectively. Realized losses recorded in 2022 and 2020 were $1.0 million and $0.3 million, respectively. No realized losses were recorded in 2021. Realized gains and losses are included in other (income) expense, net. Unrealized gains on equity securities recorded during the years ended December 31, 2022, 2021 and 2020 were $1.9 million, $5.1 million and $9.6 million, respectively. Unrealized losses on equity securities recorded during the years ended December 31, 2022, 2021 and 2020 were $11.6 million, $1.8 million and $6.0 million, respectively. Unrealized gains and losses on equity securities are included in other (income) expense, net. Unrealized gains and losses on available-for-sale debt securities are included in accumulated other comprehensive income (loss) on the balance sheet. The cost of securities sold is based on average cost. The following table sets forth by fair value hierarchy Teradyne's financial assets and liabilities that were measured at fair value on a recurring basis as of December 31, 2022 and 2021: Assets Cash Corporate debt securities Equity securities: Assets Cash Cash equivalents Available for sale securities: Corporate debt securities U.S. Treasury securities Commercial paper Debt mutual funds U.S. government agency securities Certificates of deposit and time deposits Non-U.S. government securities December 31, 2022 Quoted Prices in Active Markets for Identical Instruments (Level 1) Significant Other Observable Inputs (Level 2) Significant Unobservable Inputs (Level 3) (in thousands) $ 632,417 $ $ 161,767 60,589 50,856 39,649 7,159 6,580 - 6,352 1,740 535 Total Quated Prices December 31, 2021 Instruments (Level 1) in Active Markets for Identical Significant Other Observable Inputs (Level 2) Significant Unobservable Inputs (Level 3) Total (in thousands) $ 628,740 $ 3 Cash equivalents 412,212 81,247 | | Available for sale securities: Commercial paper 189,620 U.S. Treasury securities 77,789 56,901 Debt mutual funds 7,971 U.S. government agency securities 4,610 Certificates of deposit and time deposits 1,356 Non-U.S. government securities 589 Mutual funds 39,253 $ 628,740 493,459 189,620 77,789 56,901 7,971 4,610 1,356 589 39,253 Total $ 1,088,176 $ 412,112 $ 1,500,288 Derivative assets 92 92 Total $ 1,088,176 $ 412,204 $ 1,500,380 Liabilities Derivative liabilities Total 118 118 118 118 $ 632,417 222,356 Reported as follows: (Level 1) (Level 3) (Level 3) (in thousands) 50,856 Assets 39,649 Cash and cash equivalents $ 1,040,952 7,159 Marketable securities 6,580 Long-term marketable securities 6,352 Prepayments 1,740 535 Total 47,224 1,088,176 $ 81,247 244,231 86,634 92 S $ 412,204 Equity securities: Mutual funds 37,518 Total $ 838,282 $ 166,880 37,518 $ 1,005,162 Derivative assets 86 86 Total $ 838,282 $ 166,966 $ 1,005,248 Liabilities Derivative liabilities Total 4,215 4,215 4,215 4,215 Reported as follows: (Level 1) (Level 2) (Level 3) (in thousands) Assets Cash and cash equivalents $ 794,184 $ 60,589 $ Marketable securities 39,612 Long-term marketable securities 44,098 66,679 Prepayments 86 Total Liabilities Other current liabilities Total 838,282 $ 166,966 4,215 4,215 Liabilities Other current liabilities Total 118 118 Total $ 1,122,199 244,231 133,858 92 The carrying amounts and fair values of Teradyne's financial instruments at December 31, 2022 and 2021 were as follows: 1,500,380 118 118 December 31, 2022 Carrying Value December 31, 2021 Fair Value Carrying Value Fair Value (in thousands) Total Assets Cash and cash equivalents $ Marketable securities $ 854,773 Derivative assets 854,773 150,389 86 $ 854,773 150,389 $ 1,122,199 378,089 3 1,122,199 378,089 86 92 92 39,612 110,777 86 1,005,248 Liabilities Derivative liabilities Convertible debt 4,215 50,115 4,215 139,007 118 108,426 118 604,648 4,215 4,215 K. ACCUMULATED OTHER COMPREHENSIVE INCOME (LOSS) The following tables summarize the composition of available-for-sale marketable securities at December 31, 2022 and 2021: + December 31, 2022 Available-for-Sale Unrealized Unrealized Fair Market Cast Gain (Loss) Valuc Fair Market Value of Investments with Unrealized Lanes Changes in accumulated other comprehensive income (loss), which is presented net of tax, consist of the following: Forciga Currency Translation Adjustment Unrealized Gains (Lasics) on Marketable Securitics Unrealized Leases on Cash Flow Hedges Retirement Plans Prior Service Credit Total (in thousands) (in thousands) Corporate debt securities $ 57,006 $ 3 $ (6,153) $ 50,856 $ 50,667 U.S. Treasury securities 44,030 (4,381) 39,649 39,649 Commercial paper Balance at December 31, 2020, net of tax of $0, $1,910, $0, $(1,126), respectively $ 25,389 $ 6,954 7,089 70 7,159 Debt mutual funds 6,997 (417) 6,580 3,095 U.S. government agency securities 6,442 (90) 6,352 6,352 Certificates of deposit and time deposits 1,740 1,740 Non-U.S. government securities 535 535 123,839 $ (11,041) $ 112,871 99,763 Reported as follows: Cast Unrealized Gain Unrealized (Loss) Market Value Marketable securities Long-term marketable securities $ 39,950 $ 70 $ (in thousands) (408) $ 83,889 (10,633) 39,612 73,259 $ $ 123,839 $ (11,041) $ 112,871 December 31, 2021 Available-for-Sale Unrealized Unrealized Fair Market Cast Gain (Loss) Valut (in thousands) Commercial paper U.S. Treasury securities $ 189,614 15 $ (9) $ 189,620 $ 77,707 551 (470) 77,789 Corporate debt securities 52,266 4,863 (227) 56,901 Debt mutual funds 7,928 43 7,971 U.S. government agency securities 4,617 (12) 4,610 Certificates of deposit and time deposits 1,356 1,356 Non-U.S. government securities 589 589 334,077 5,477 (718) 338,836 Reported as follows: Fair Market Value of Investments with Unrealized Lanes 30,713 69,050 99,763 Fair Market Value of Investments with Unrealized Lanes Other comprehensive loss before reclassifications, net of tax of $0, $(578). $0, $0, respectively Amounts reclassified from accumulated other comprehensive income, net of tax of $0. $(277). $0, $(2), respectively Net current period other comprehensive loss, net of tax of $0, $(855). $0, $(2). respectively Balance at December 31, 2021, net of tax of $0, $1,055, $0, $(1,128), respectively Other comprehensive loss before reclassifications, net of tax of $0, $(3,388). $(708), $0, respectively Amounts reclassified from accumulated other comprehensive income (loss), net of tax of $0, $25, $0, $(2), respectively Net current period other comprehensive loss, net of tax of $0, $(3,363). $(708). $(2), respectively Balance at December 31, 2022, net of tax of $0, (36,207) (2,255) 3 1,173 $ 33,516 (38,462) (995) (1,002) (36,207) (3,250) $ (10,818) $ 3,704 $ (29,031) (12,666) (2,517) (39,464) $ 1,166 $ (5,948) (44,214) 301 294 $(2,308). $(708). $(1,130), respectively (29,031) (12,365) (2,517) (43,920) $ (39,849) $ (8,661) (2,517) 1,159 $ (49,868) 22,784 46,435 19,422 3,296 91,937 Fair Cast Unrealized Gain Unrealized (Loss) Market Valuc (in thousands) Marketable securities Long-term marketable securities $ 244,213 $ 64 $ (46) $ 244,231 $ 89,864 $ 334,077 5,413 5,477 (672) 94,605 (718) $ 338,836 Fair Market Value of Investments with Unrealized Lasses 54,798 37,139 91,937 As of December 31, 2022, the fair market value of investments with unrealized losses less than one year and greater than one year totaled $66.3 million and $33.4 million, respectively. As of December 31, 2021, the fair market value of investments with unrealized losses less than one year and greater than one year totaled $85.4 million and $6.5 million, respectively. Teradyne reviews its investments to identify and evaluate investments that have an indication of possible impairment. Based on this review, Teradyne determined that the unrealized losses related to these investments at December 31, 2022 and 2021, were not other than temporary.
Step by Step Solution
There are 3 Steps involved in it
Step: 1

Get Instant Access to Expert-Tailored Solutions
See step-by-step solutions with expert insights and AI powered tools for academic success
Step: 2

Step: 3

Ace Your Homework with AI
Get the answers you need in no time with our AI-driven, step-by-step assistance
Get Started


