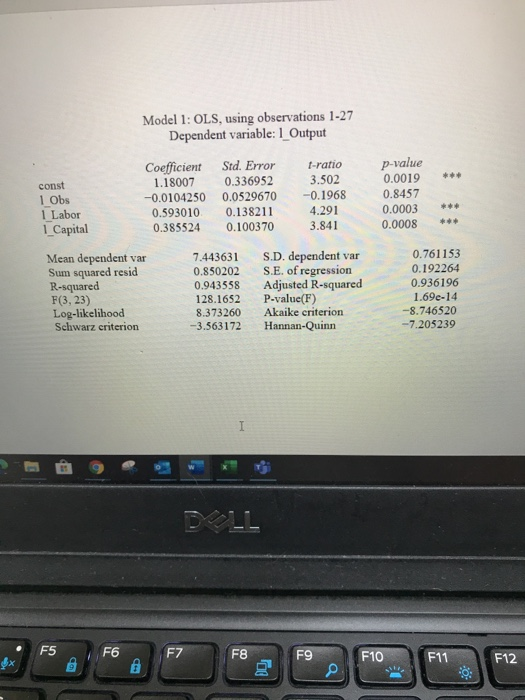
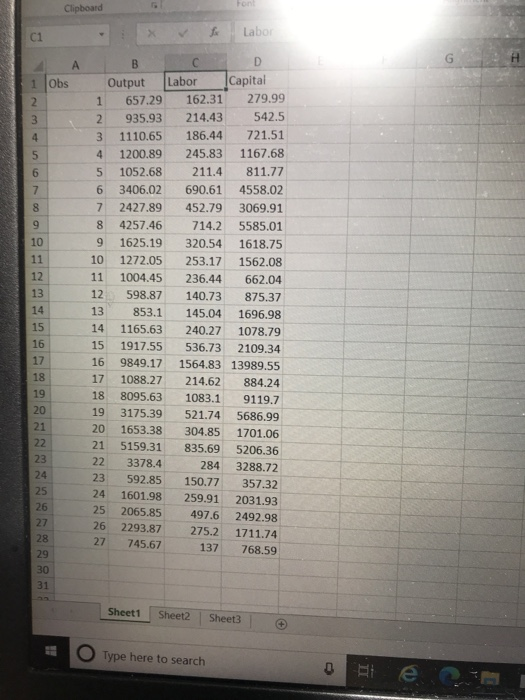
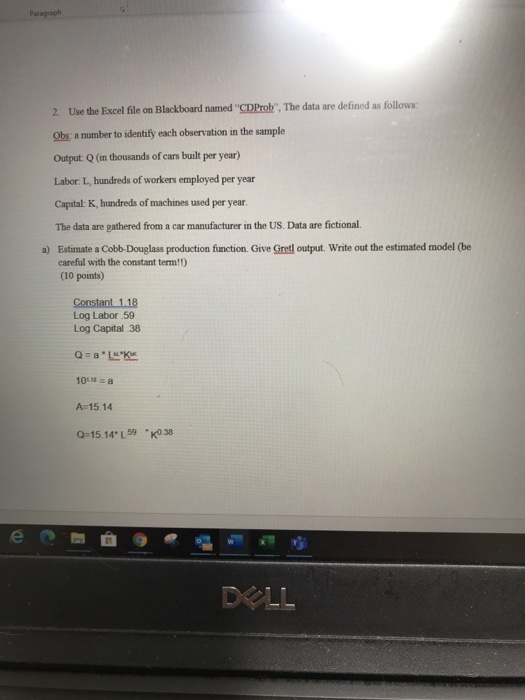
2. Use the Excel file on Blackboard named "CDProb", The data are defined as follows: Obs: a number to identify cach observation in the sample Output: Q (in thousands of cars built per year) Labor: L, hundreds of workers employed per year Capital: K hundreds of machines used per year. The data are gathered from a car manufacturer in the US. Data are fictional. a) Estimate a Cobb-Douglass production function. Give Gretl output. Write out the estimated model (be careful with the constant term!!) (10 points) b) Assume that the car manufacturer only has access to 50,000 machines at the moment. Solve for the firm's short run production function (5 points) c) Using the model from b) you have calculated, calculate the following assuming that the firm hires 20,000 workers iv) Output (3 points) v) Average product (3 points) vi) Marginal product (4 points) e DLL Model 1: OLS, using observations 1-27 Dependent variable: 1_ Output * const 1 Obs 1 Labor 1_Capital Coefficient 1.18007 -0.0104250 0.593010 0.385524 Std. Error 0.336952 0.0529670 0.138211 0.100370 t-ratio 3.502 -0.1968 4.291 3.841 p-value 0.0019 0.8457 0.0003 0.0008 * Mean dependent var Sum squared resid R-squared F(3, 23) Log-likelihood Schwarz criterion 7.443631 0.850202 0.943558 128.1652 8.373260 -3.563172 S.D. dependent var S.E. of regression Adjusted R-squared P-value(F) Akaike criterion Hannan-Quinn 0.761153 0.192264 0.936196 1.69e-14 -8.746520 -7.205239 I F5 F6 FZ F8 F9 F10 $* F11 F12 @ O - Model 1: OLS, using observations 1-27 Dependent variable: 1 Output const 1 Obs 1 Labor 1 Capital Coefficient 1.18007 -0.0104250 0.593010 0.385524 Std. Error 0.336952 0.0529670 0.138211 0.100370 I-ratio 3.502 -0.1968 4.291 3.841 p-value 0.0019 0.8457 0.0003 0.0008 * Mean dependent var Sum squared resid R-squared F(3,23) Log-likelihood Schwarz criterion 7.443631 0.850202 0.943558 128.1652 8.373260 -3.563172 S.D. dependent var S.E. of regression Adjusted R-squared P-value(F) Akaike criterion Hannan-Quinn 0.761153 0.192264 0.936196 1.69e-14 -8.746520 -7.205239 DOLL F5 F6 F7 @ F8 F9 F10 F11 F12 To a Clipboard Labo C1 1 Obs 2 3 4 5 6 7 8 9 10 11 12 13 14 15 16 17 18 19 20 21 22 23 24 25 26 B D Output Labor Capital 1 657.29 162.31 279.99 2 935.93 214.43 542.5 3 1110.65 186.44 721.51 4 1200.89 245.83 1167.68 5 1052.68 211.4 811.77 6 3406.02 690.61 4558.02 7 2427.89 452.79 3069.91 8 4257.46 714.2 5585.01 9 1625.19 320.54 1618.75 10 1272.05 253.17 1562.08 11 1004.45 236.44 662.04 12 598.87 140.73 875.37 13 853.1 145.04 1696.98 14 1165.63 240.27 1078.79 15 1917.55 536.73 2109.34 16 9849.17 1564.83 13989.55 17 1088.27 214.62 884.24 18 8095.63 1083.1 9119.7 19 3175.39 521.74 5686.99 20 1653.38 304.85 1701.06 21 5159.31 835.69 5206.36 22 3378.4 284 3288.72 23 592.85 150.77 357.32 24 1601.98 259.91 2031.93 25 2065.85 497.6 2492.98 26 2293.87 275.2 1711.74 27 745.67 137 768.59 27 28 29 30 31 Sheet1 Sheet2 Sheet3 Type here to search D Paragraph 2. Use the Excel file on Blackboard named "CDProb". The data are defined as follows: Obs a number to identify each observation in the sample Output: Q (in thousands of cars built per year) Labor: L, hundreds of workers employed per year Capital:K, hundreds of machines used per year. The data are gathered from a car manufacturer in the US. Data are fictional. a) Estimate a Cobb Douglass production function. Give Gretl output. Write out the estimated model (be careful with the constant term!) (10 points) Constant 1.18 Log Labor 59 Log Capital 38 a* * * 101 a A=15.14 Q=15.1459 0 38 DIL b) Assume that the car manufacturer only has access to 50,000 machines at the moment. Solve for the firm's short run production function. (5 points) Q=15.14 L 59 50,0000.38 Q=15.1459 "6104 Q=924 15. 59 c) Using the model from b) you have calculated, calculate the following assuming that the firm hires 20,000 workers ) Output (3 points) Q-15.14. 20.000 69 6104 Q=15.14 344.83061.04 Q-318,673 V) Average product (3 points) Labor 318,673/20,000 =1593 Capital-318,673/50,000 =638 vi) Marginal product (4 points) SMP of Labor 59 MP of Capital? RI DLL 3 F4 6x F5 F6 F7 F8 F9 F10 F11 F12 q + $ % 2. Use the Excel file on Blackboard named "CDProb", The data are defined as follows: Obs: a number to identify cach observation in the sample Output: Q (in thousands of cars built per year) Labor: L, hundreds of workers employed per year Capital: K hundreds of machines used per year. The data are gathered from a car manufacturer in the US. Data are fictional. a) Estimate a Cobb-Douglass production function. Give Gretl output. Write out the estimated model (be careful with the constant term!!) (10 points) b) Assume that the car manufacturer only has access to 50,000 machines at the moment. Solve for the firm's short run production function (5 points) c) Using the model from b) you have calculated, calculate the following assuming that the firm hires 20,000 workers iv) Output (3 points) v) Average product (3 points) vi) Marginal product (4 points) e DLL Model 1: OLS, using observations 1-27 Dependent variable: 1_ Output * const 1 Obs 1 Labor 1_Capital Coefficient 1.18007 -0.0104250 0.593010 0.385524 Std. Error 0.336952 0.0529670 0.138211 0.100370 t-ratio 3.502 -0.1968 4.291 3.841 p-value 0.0019 0.8457 0.0003 0.0008 * Mean dependent var Sum squared resid R-squared F(3, 23) Log-likelihood Schwarz criterion 7.443631 0.850202 0.943558 128.1652 8.373260 -3.563172 S.D. dependent var S.E. of regression Adjusted R-squared P-value(F) Akaike criterion Hannan-Quinn 0.761153 0.192264 0.936196 1.69e-14 -8.746520 -7.205239 I F5 F6 FZ F8 F9 F10 $* F11 F12 @ O - Model 1: OLS, using observations 1-27 Dependent variable: 1 Output const 1 Obs 1 Labor 1 Capital Coefficient 1.18007 -0.0104250 0.593010 0.385524 Std. Error 0.336952 0.0529670 0.138211 0.100370 I-ratio 3.502 -0.1968 4.291 3.841 p-value 0.0019 0.8457 0.0003 0.0008 * Mean dependent var Sum squared resid R-squared F(3,23) Log-likelihood Schwarz criterion 7.443631 0.850202 0.943558 128.1652 8.373260 -3.563172 S.D. dependent var S.E. of regression Adjusted R-squared P-value(F) Akaike criterion Hannan-Quinn 0.761153 0.192264 0.936196 1.69e-14 -8.746520 -7.205239 DOLL F5 F6 F7 @ F8 F9 F10 F11 F12 To a Clipboard Labo C1 1 Obs 2 3 4 5 6 7 8 9 10 11 12 13 14 15 16 17 18 19 20 21 22 23 24 25 26 B D Output Labor Capital 1 657.29 162.31 279.99 2 935.93 214.43 542.5 3 1110.65 186.44 721.51 4 1200.89 245.83 1167.68 5 1052.68 211.4 811.77 6 3406.02 690.61 4558.02 7 2427.89 452.79 3069.91 8 4257.46 714.2 5585.01 9 1625.19 320.54 1618.75 10 1272.05 253.17 1562.08 11 1004.45 236.44 662.04 12 598.87 140.73 875.37 13 853.1 145.04 1696.98 14 1165.63 240.27 1078.79 15 1917.55 536.73 2109.34 16 9849.17 1564.83 13989.55 17 1088.27 214.62 884.24 18 8095.63 1083.1 9119.7 19 3175.39 521.74 5686.99 20 1653.38 304.85 1701.06 21 5159.31 835.69 5206.36 22 3378.4 284 3288.72 23 592.85 150.77 357.32 24 1601.98 259.91 2031.93 25 2065.85 497.6 2492.98 26 2293.87 275.2 1711.74 27 745.67 137 768.59 27 28 29 30 31 Sheet1 Sheet2 Sheet3 Type here to search D Paragraph 2. Use the Excel file on Blackboard named "CDProb". The data are defined as follows: Obs a number to identify each observation in the sample Output: Q (in thousands of cars built per year) Labor: L, hundreds of workers employed per year Capital:K, hundreds of machines used per year. The data are gathered from a car manufacturer in the US. Data are fictional. a) Estimate a Cobb Douglass production function. Give Gretl output. Write out the estimated model (be careful with the constant term!) (10 points) Constant 1.18 Log Labor 59 Log Capital 38 a* * * 101 a A=15.14 Q=15.1459 0 38 DIL b) Assume that the car manufacturer only has access to 50,000 machines at the moment. Solve for the firm's short run production function. (5 points) Q=15.14 L 59 50,0000.38 Q=15.1459 "6104 Q=924 15. 59 c) Using the model from b) you have calculated, calculate the following assuming that the firm hires 20,000 workers ) Output (3 points) Q-15.14. 20.000 69 6104 Q=15.14 344.83061.04 Q-318,673 V) Average product (3 points) Labor 318,673/20,000 =1593 Capital-318,673/50,000 =638 vi) Marginal product (4 points) SMP of Labor 59 MP of Capital? RI DLL 3 F4 6x F5 F6 F7 F8 F9 F10 F11 F12 q + $ %