Answered step by step
Verified Expert Solution
Question
1 Approved Answer
2. Use the following information for Q2a - Q2h On 24th Feb 2017, you collected data on European-style put options written on the S&P500


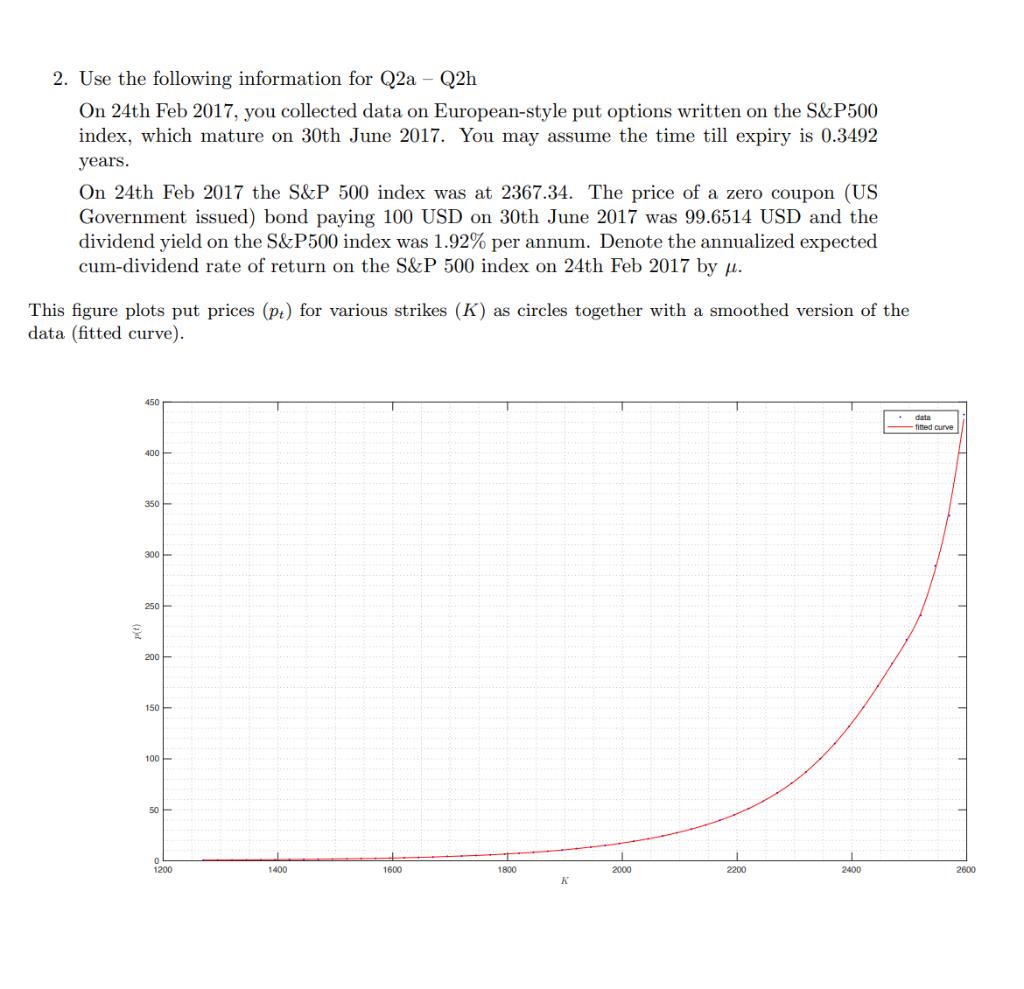
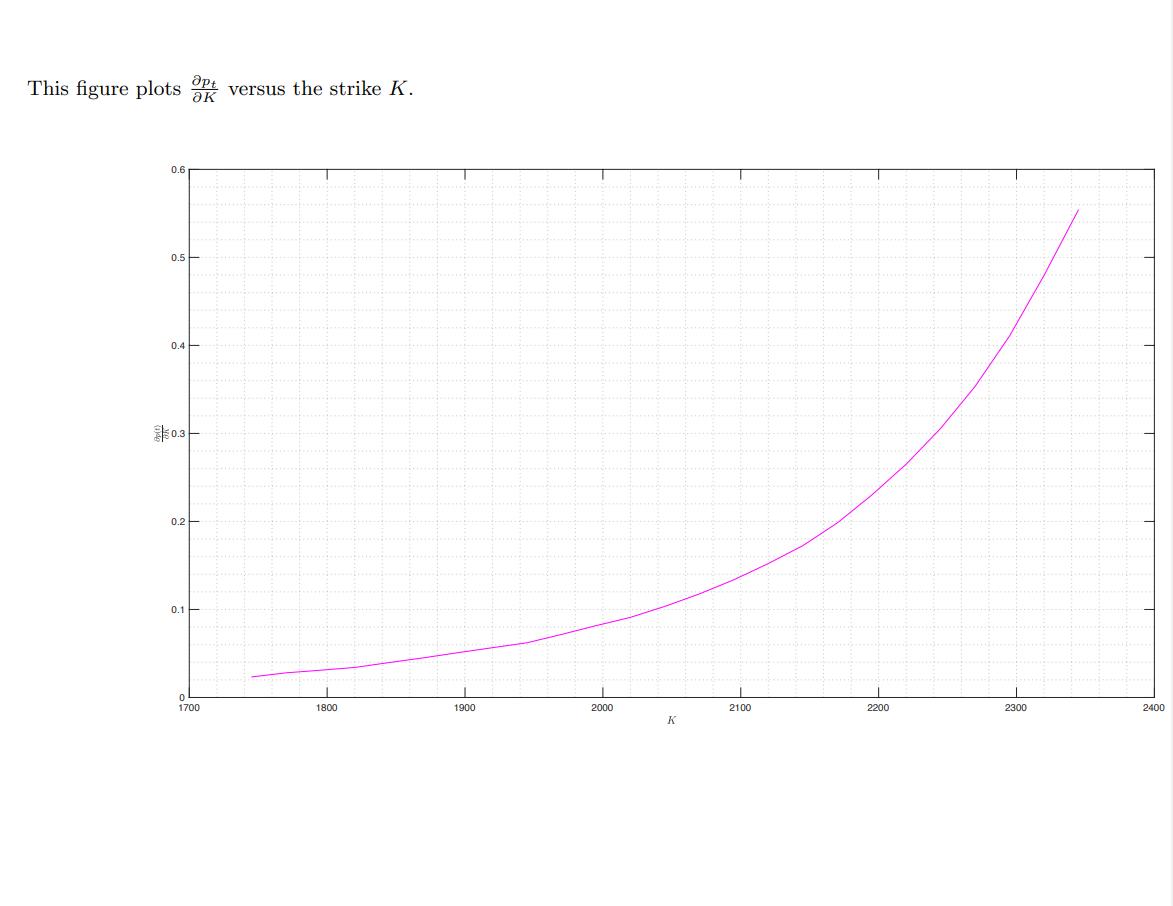
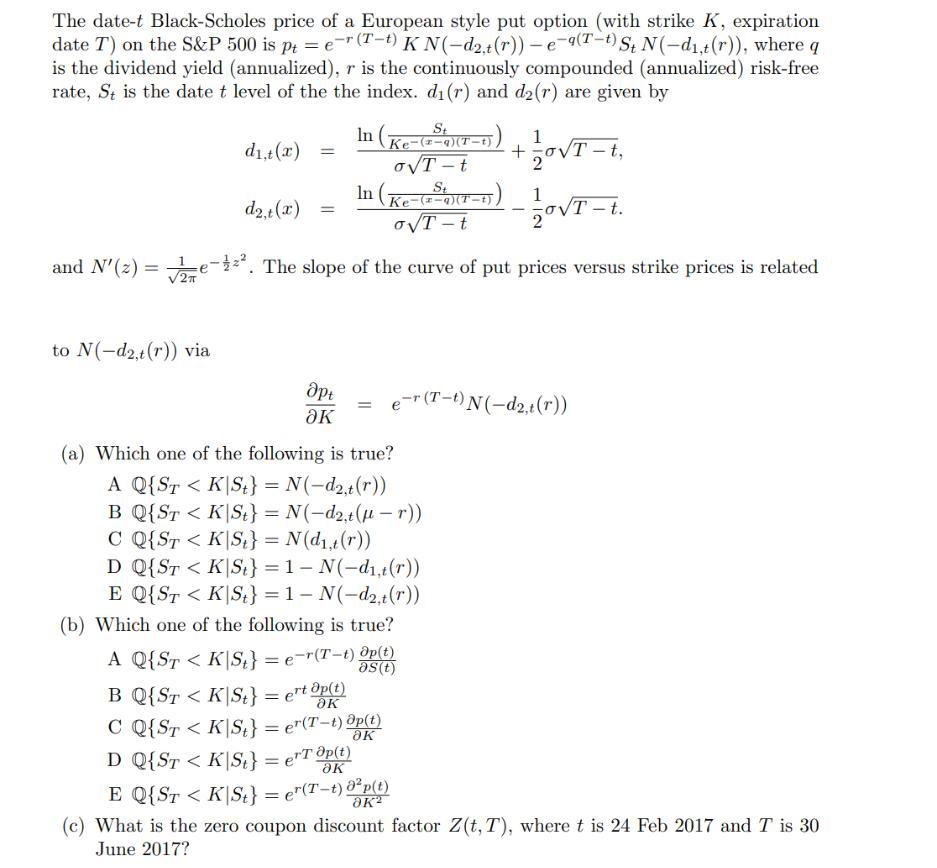
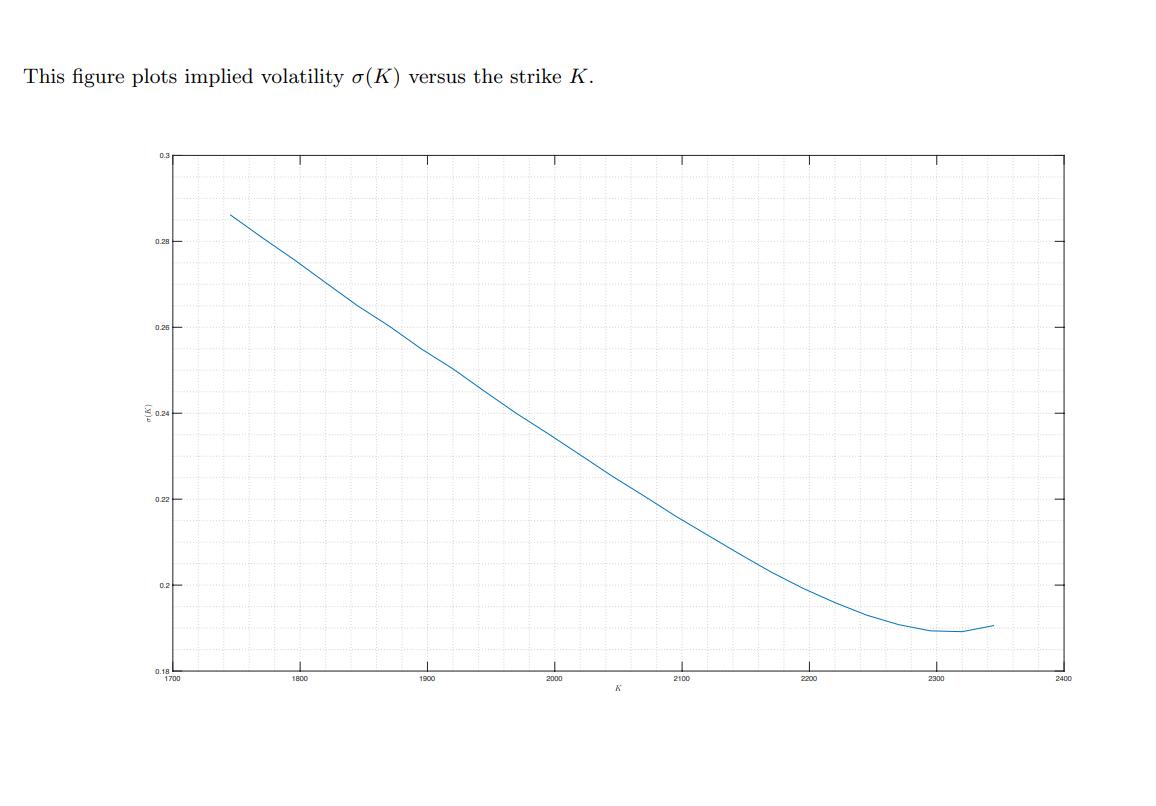
2. Use the following information for Q2a - Q2h On 24th Feb 2017, you collected data on European-style put options written on the S&P500 index, which mature on 30th June 2017. You may assume the time till expiry is 0.3492 years. On 24th Feb 2017 the S&P 500 index was at 2367.34. The price of a zero coupon (US Government issued) bond paying 100 USD on 30th June 2017 was 99.6514 USD and the dividend yield on the S&P500 index was 1.92% per annum. Denote the annualized expected cum-dividend rate of return on the S&P 500 index on 24th Feb 2017 by u. This figure plots put prices (pt) for various strikes (K) as circles together with a smoothed version of the data (fitted curve). 450 400- 350- 300 CM 250- 200 150- 100- 50 data fitted curve 1200 1400 1600 1800 2000 2200 2400 2600 K This figure plots versus the strike K. 0.6 0.5 0.4 0.3 0.2 0.1 0 1700 1800 1900 2000 2100 2200 2300 2400 K The date-t Black-Scholes price of a European style put option (with strike K, expiration date T) on the S&P 500 is pt = er (T-t) KN(-d2t (r))-e-9(T-t) St N (-dt(r)), where q is the dividend yield (annualized), r is the continuously compounded (annualized) risk-free rate, St is the date t level of the the index. d(r) and d(r) are given by In St d,t (x) = Ke-(-a)(T-t) OT-t 1 + oT t, 1 d2, (x) = - T - t. In (Ke-((-)) oT-t and N'(z) = e. The slope of the curve of put prices versus strike prices is related to N(-d2,t (r)) via apt e-r (T-t) N(-d2t(r)) = (a) Which one of the following is true? A Q{ST < K St} = N(-d2t(r)) B Q{ST This figure plots implied volatility (K) versus the strike K. 0.3 0.28 0.26 0.24 0.22 0.2 0.18 1700 1800 1900 2000 2100 2200 2300 2400 K
Step by Step Solution
There are 3 Steps involved in it
Step: 1

Get Instant Access to Expert-Tailored Solutions
See step-by-step solutions with expert insights and AI powered tools for academic success
Step: 2

Step: 3

Ace Your Homework with AI
Get the answers you need in no time with our AI-driven, step-by-step assistance
Get Started


