Answered step by step
Verified Expert Solution
Question
1 Approved Answer
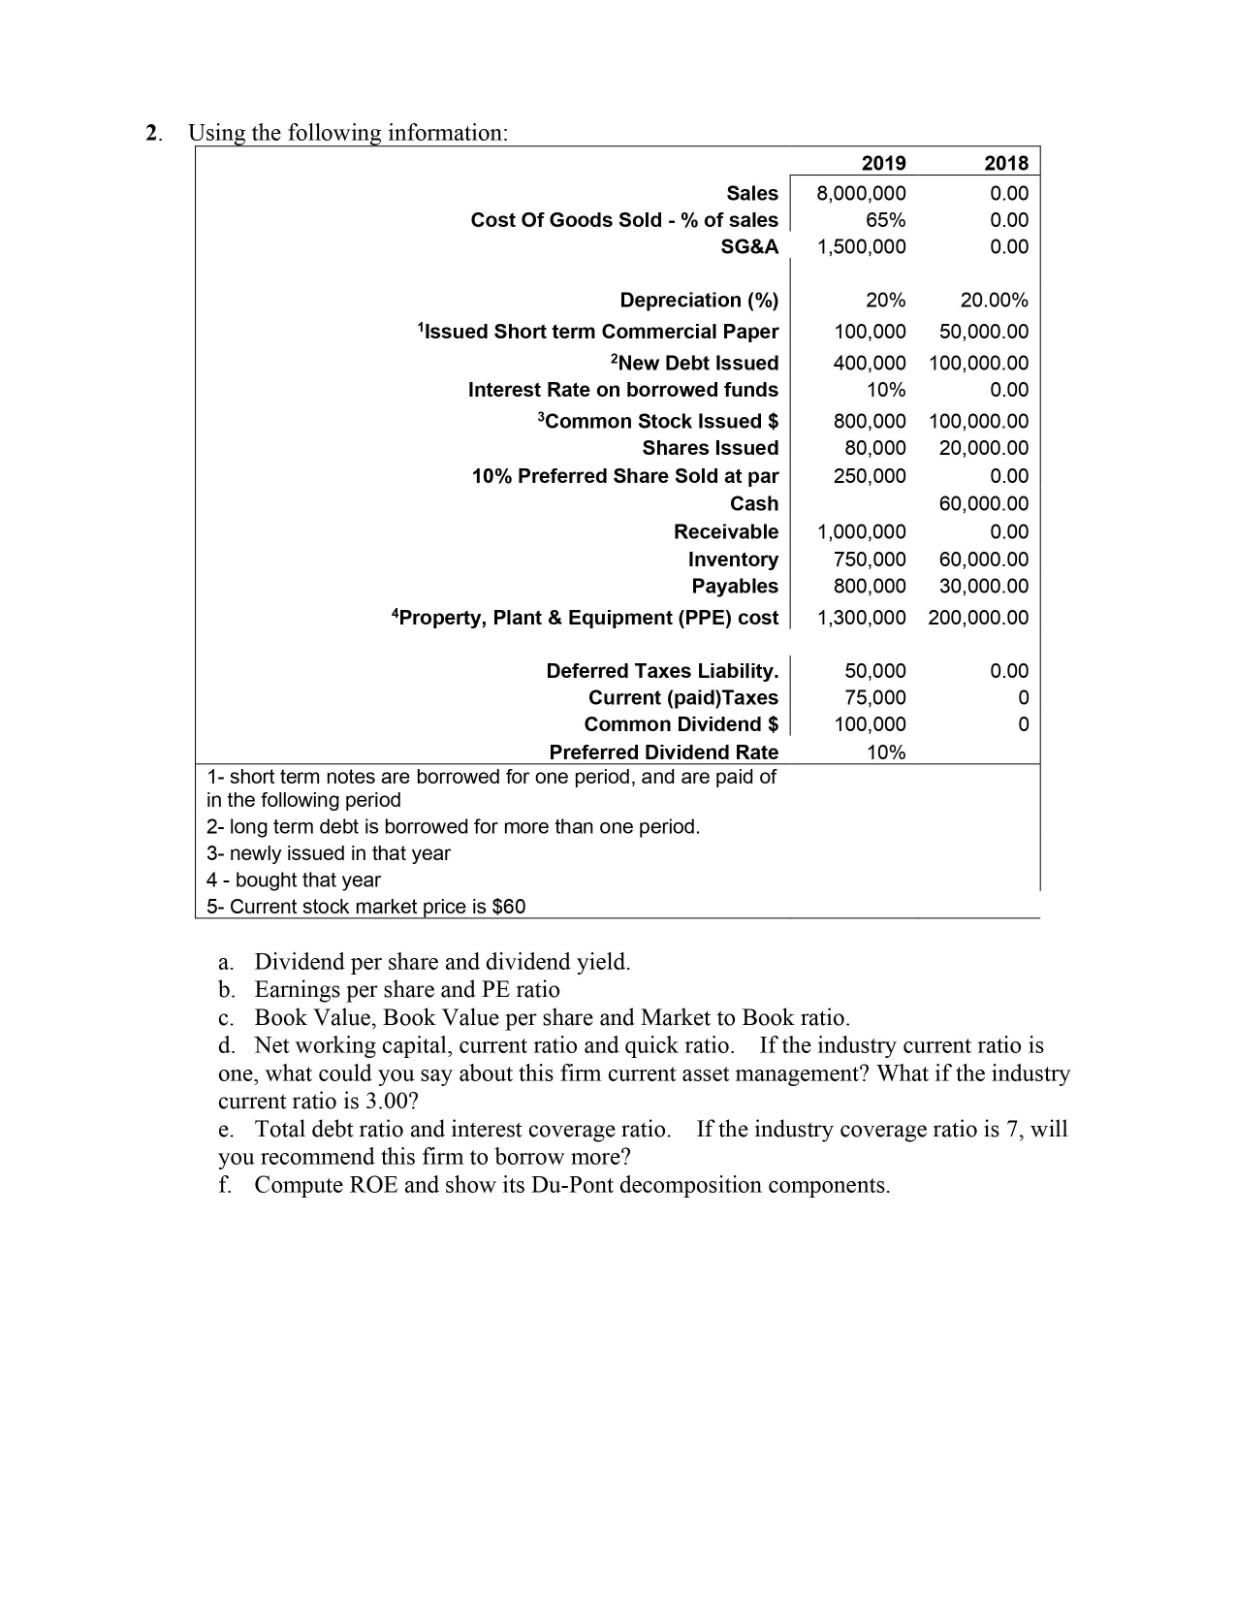
2. Using the following information: Sales Cost Of Goods Sold - % of sales SG&A Depreciation (%) Issued Short term Commercial Paper 2New Debt


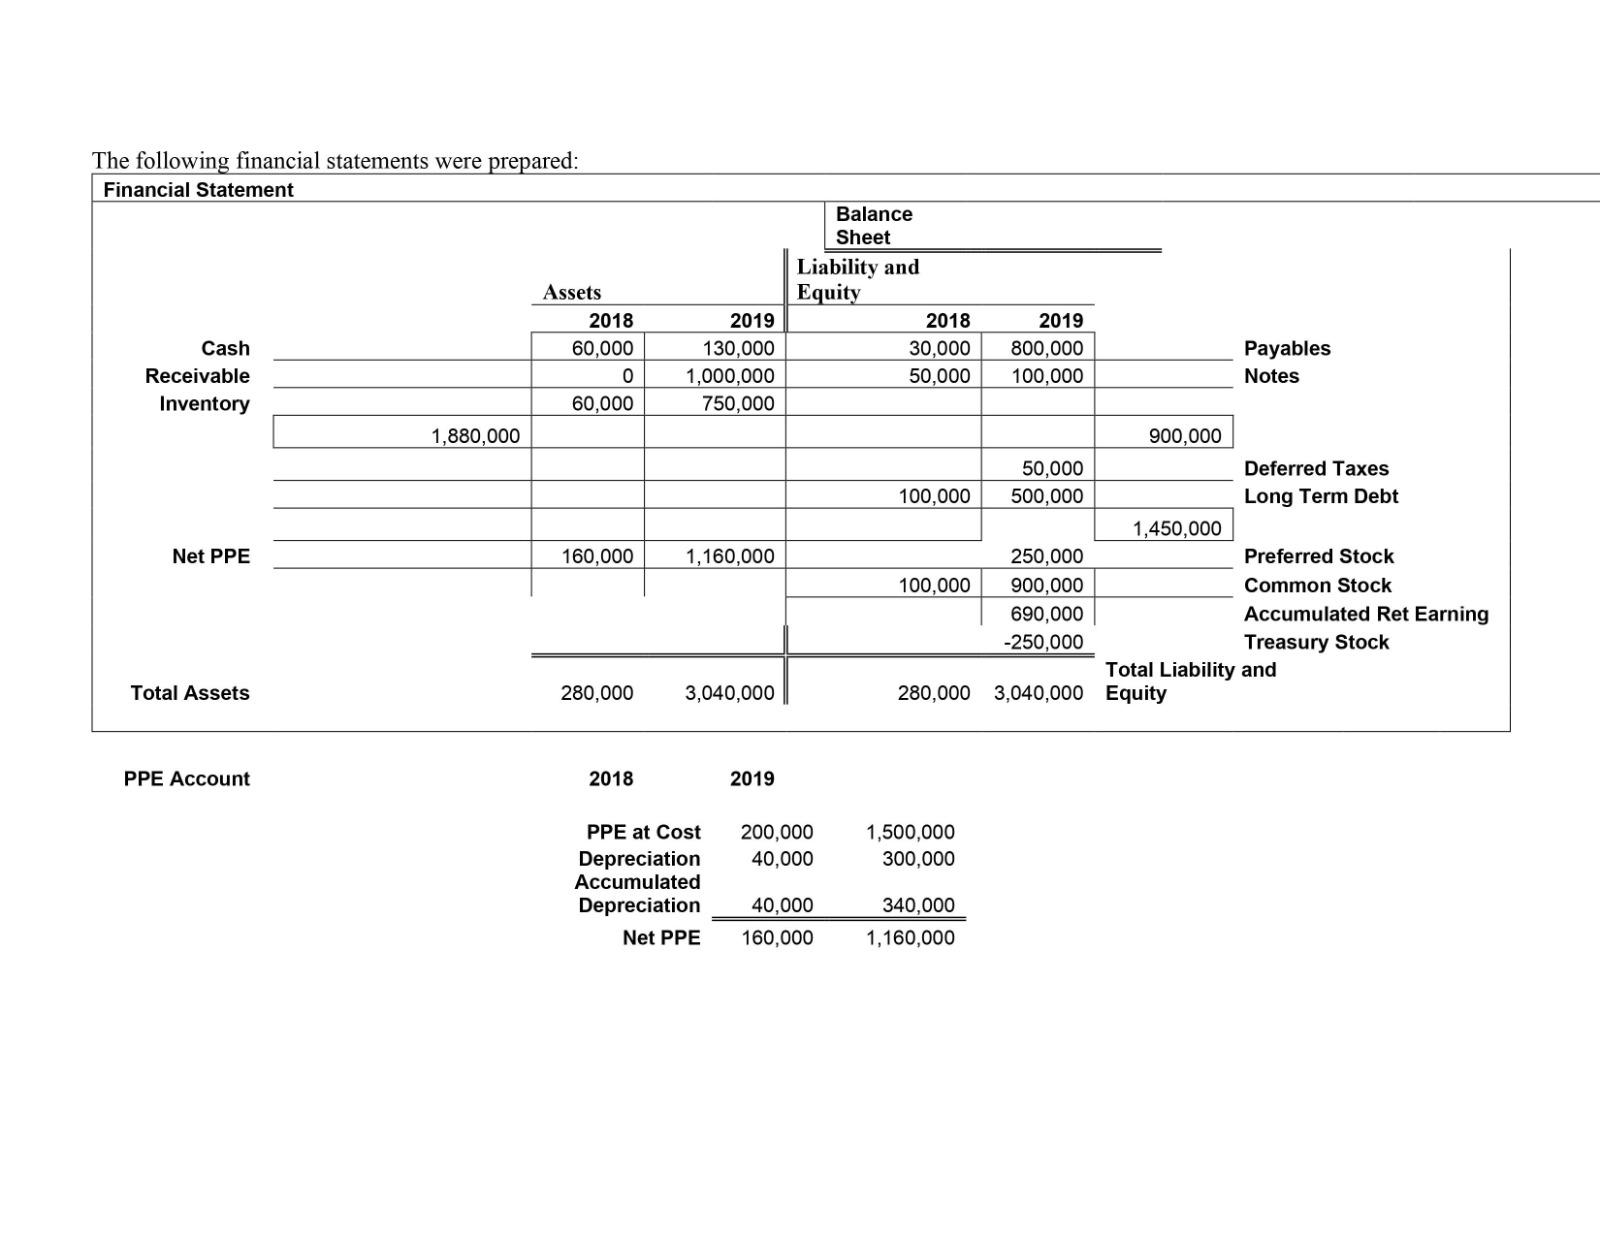
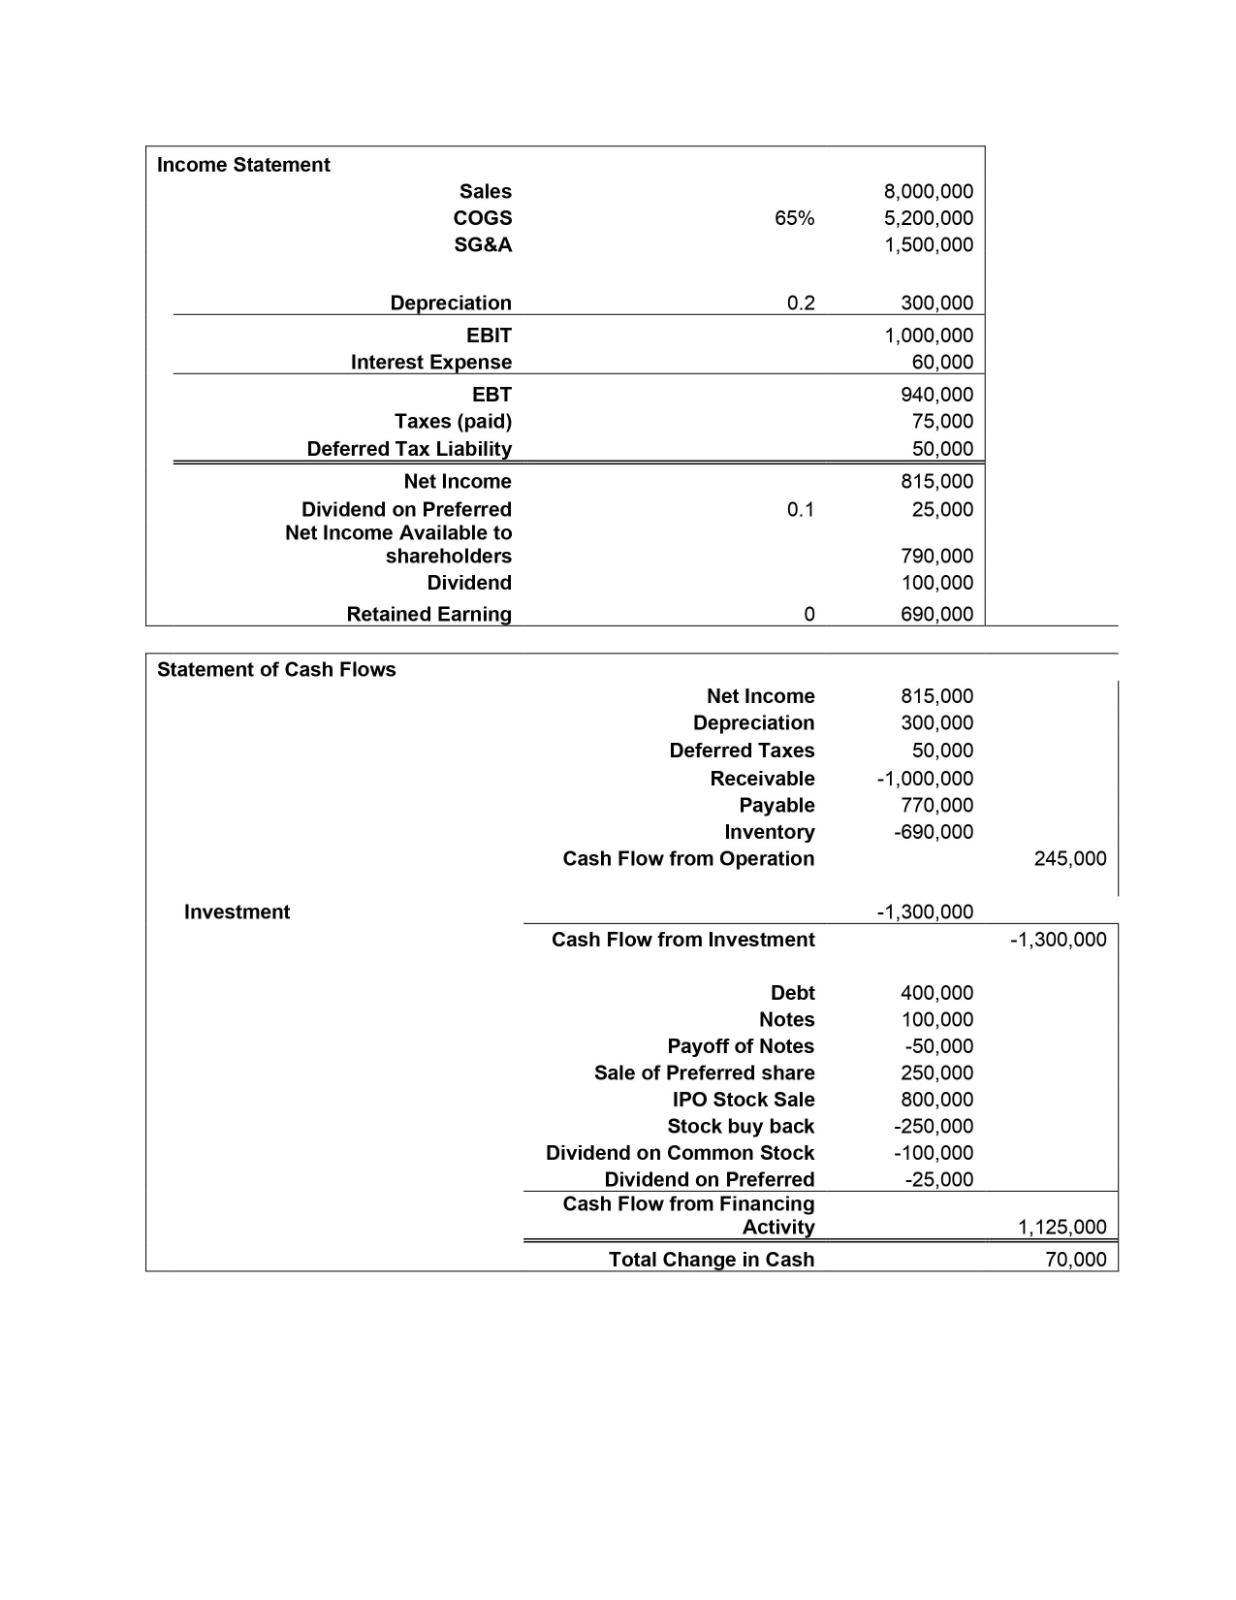
2. Using the following information: Sales Cost Of Goods Sold - % of sales SG&A Depreciation (%) Issued Short term Commercial Paper 2New Debt Issued Interest Rate on borrowed funds Common Stock Issued $ Shares Issued 10% Preferred Share Sold at par Cash Receivable Inventory Payables 4Property, Plant & Equipment (PPE) cost Deferred Taxes Liability. Current (paid)Taxes Common Dividend $ Preferred Dividend Rate 1- short term notes are borrowed for one period, and are paid of in the following period 2- long term debt is borrowed for more than one period. 3- newly issued in that year 4- bought that year 5- Current stock market price is $60 2019 8,000,000 65% 1,500,000 20% 20.00% 100,000 50,000.00 400,000 100,000.00 10% 0.00 800,000 100,000.00 80,000 20,000.00 250,000 0.00 60,000.00 1,000,000 0.00 750,000 60,000.00 800,000 30,000.00 1,300,000 200,000.00 50,000 75,000 100,000 10% 2018 0.00 0.00 0.00 a. Dividend per share and dividend yield. b. Earnings per share and PE ratio c. Book Value, Book Value per share and Market to Book ratio. 0.00 0 0 d. Net working capital, current ratio and quick ratio. If the industry current ratio is one, what could you say about this firm current asset management? What if the industry current ratio is 3.00? e. Total debt ratio and interest coverage ratio. If the industry coverage ratio is 7, will you recommend this firm to borrow more? f. Compute ROE and show its Du-Pont decomposition components. The following financial statements were prepared: Financial Statement Cash Receivable Inventory Net PPE Total Assets PPE Account 1,880,000 Assets 2018 60,000 0 60,000 160,000 280,000 2018 2019 130,000 1,000,000 750,000 1,160,000 3,040,000 2019 Balance Sheet Liability and Equity PPE at Cost 200,000 Depreciation 40,000 Accumulated Depreciation 40,000 Net PPE 160,000 2018 2019 30,000 800,000 50,000 100,000 50,000 100,000 500,000 100,000 1,500,000 300,000 250,000 900,000 690,000 -250,000 340,000 1,160,000 900,000 1,450,000 280,000 3,040,000 Equity Payables Notes Deferred Taxes Long Term Debt Preferred Stock Common Stock Accumulated Ret Earning Treasury Stock Total Liability and Income Statement Sales COGS SG&A Depreciation Investment EBIT Interest Expense EBT Taxes (paid) Deferred Tax Liability Net Income Dividend on Preferred Net Income Available to shareholders Dividend Retained Earning Statement of Cash Flows 65% 0.2 0.1 0 Net Income Depreciation Deferred Taxes Receivable Payable Inventory Cash Flow from Operation Cash Flow from Investment Debt Notes Payoff of Notes Sale of Preferred share IPO Stock Sale Stock buy back Dividend on Common Stock Dividend on Preferred Cash Flow from Financing Activity Total Change in Cash 8,000,000 5,200,000 1,500,000 300,000 1,000,000 60,000 940,000 75,000 50,000 815,000 25,000 790,000 100,000 690,000 815,000 300,000 50,000 -1,000,000 770,000 -690,000 -1,300,000 400,000 100,000 -50,000 250,000 800,000 -250,000 -100,000 -25,000 245,000 -1,300,000 1,125,000 70,000
Step by Step Solution
★★★★★
3.36 Rating (140 Votes )
There are 3 Steps involved in it
Step: 1
a Dividend per share and dividend yieldDividend per share Preferred dividend rate x par value of preferred shares 10 x 100 10Dividend yield Dividend p...
Get Instant Access to Expert-Tailored Solutions
See step-by-step solutions with expert insights and AI powered tools for academic success
Step: 2

Step: 3

Ace Your Homework with AI
Get the answers you need in no time with our AI-driven, step-by-step assistance
Get Started


