

Answered step by step
Verified Expert Solution
Question
1 Approved Answer
2) Value USG under its current operating and financial strategies. How does your valuation compare to the current market price? Value USG under the proposed
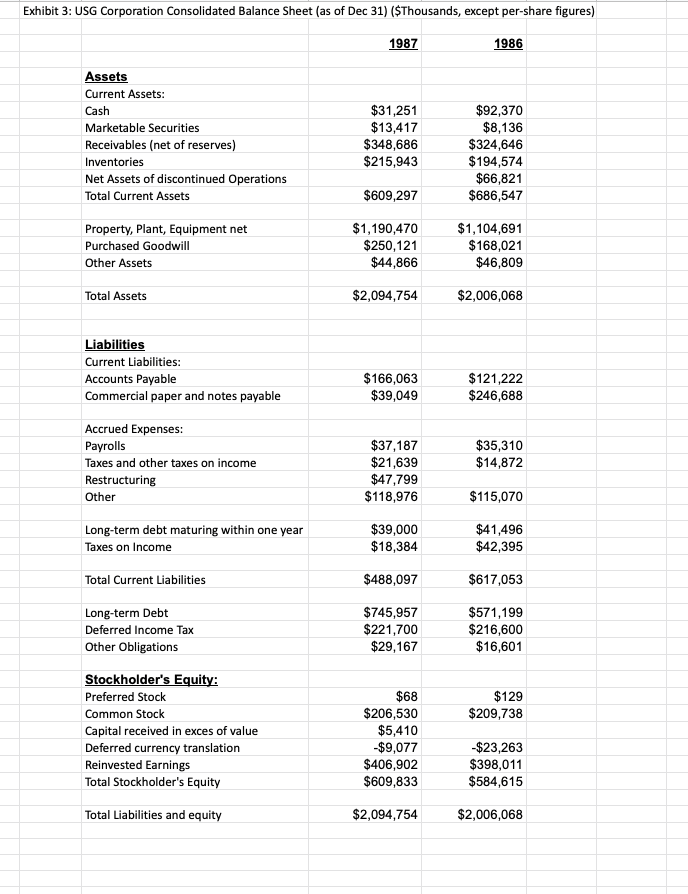
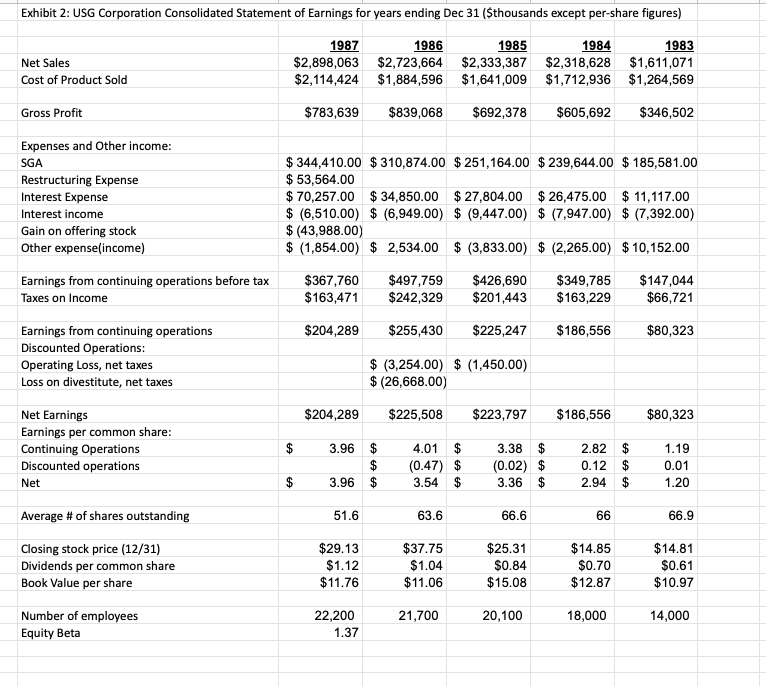
2) Value USG under its current operating and financial strategies. How does your valuation compare to the current market price? Value USG under the proposed recapitalization plan. Exhibit 3: USG Corporation Consolidated Balance Sheet (as of Dec 31) ($Thousands, except per-share figures) 1987 1986 Assets Current Assets: Cash Marketable Securities Receivables (net of reserves) Inventories Net Assets of discontinued Operations Total Current Assets $31,251 $13,417 $348,686 $215,943 $92,370 $8,136 $324,646 $194,574 $66,821 $686,547 $609,297 Property, Plant, Equipment net Purchased Goodwill Other Assets $1,190,470 $250,121 $44,866 $1,104,691 $168,021 $46,809 Total Assets $2,094,754 $2,006,068 Liabilities Current Liabilities: Accounts Payable Commercial paper and notes payable $166,063 $39,049 $121,222 $246,688 Accrued Expenses: Payrolls Taxes and other taxes on income Restructuring Other $35,310 $14,872 $37,187 $21,639 $47,799 $118,976 $115,070 Long-term debt maturing within one year Taxes on Income $39,000 $18,384 $41,496 $42,395 Total Current Liabilities $488,097 $617,053 Long-term Debt Deferred Income Tax Other Obligations $745,957 $221,700 $29,167 $571,199 $216,600 $16,601 $129 $209,738 Stockholder's Equity: Preferred Stock Common Stock Capital received in exces of value Deferred currency translation Reinvested Earnings Total Stockholder's Equity $68 $206,530 $5,410 -$9,077 $406,902 $609,833 -$23,263 $398,011 $584,615 Total Liabilities and equity $2,094,754 $2,006,068 Exhibit 2: USG Corporation Consolidated Statement of Earnings for years ending Dec 31 ($thousands except per-share figures) Net Sales Cost of Product Sold 1987 1986 1985 1984 1983 $2,898,063 $2,723,664 $2,333,387 $2,318,628 $1,611,071 $2,114,424 $1,884,596 $1,641,009 $1,712,936 $1,264,569 Gross Profit $783,639 $839,068 $692,378 $605,692 $346,502 Expenses and Other income: SGA Restructuring Expense Interest Expense Interest income Gain on offering stock Other expense(income) $ 344,410.00 $ 310,874.00 $ 251,164.00 $ 239,644.00 $ 185,581.00 $ 53,564.00 $ 70,257.00 $ 34,850.00 $ 27,804.00 $ 26,475.00 $ 11,117.00 $ (6,510.00) $ (6,949.00) $ (9,447.00) $ (7,947.00) $ (7,392.00) $(43,988.00) $ (1,854.00) $ 2,534.00 $ (3,833.00) $ (2,265.00) $10,152.00 Earnings from continuing operations before tax Taxes on Income $367,760 $163,471 $497,759 $242,329 $426,690 $201,443 $349,785 $163,229 $147,044 $66,721 $204,289 $255,430 $225,247 $186,556 $80,323 Earnings from continuing operations Discounted Operations: Operating Loss, net taxes Loss on divestitute, net taxes $ (3,254.00) $ (1,450.00) $ (26,668.00) $204,289 $225,508 $223,797 $186,556 $80,323 Net Earnings Earnings per common share: Continuing Operations Discounted operations Net $ 3.96 $ $ $ 4.01 $ (0.47) $ 3.54 $ 3.38 $ (0.02) $ 3.36 $ 2.82 $ 0.12 $ 2.94 $ 1.19 0.01 1.20 $ 3.96 51.6 63.6 66.6 66 66.9 Average # of shares outstanding Closing stock price (12/31) Dividends per common share Book Value per share $29.13 $1.12 $11.76 $37.75 $1.04 $11.06 $25.31 $0.84 $15.08 $14.85 $0.70 $12.87 $14.81 $0.61 $10.97 21,700 20,100 18,000 22,200 1.37 Number of employees Equity Beta 14,000 2) Value USG under its current operating and financial strategies. How does your valuation compare to the current market price? Value USG under the proposed recapitalization plan. Exhibit 3: USG Corporation Consolidated Balance Sheet (as of Dec 31) ($Thousands, except per-share figures) 1987 1986 Assets Current Assets: Cash Marketable Securities Receivables (net of reserves) Inventories Net Assets of discontinued Operations Total Current Assets $31,251 $13,417 $348,686 $215,943 $92,370 $8,136 $324,646 $194,574 $66,821 $686,547 $609,297 Property, Plant, Equipment net Purchased Goodwill Other Assets $1,190,470 $250,121 $44,866 $1,104,691 $168,021 $46,809 Total Assets $2,094,754 $2,006,068 Liabilities Current Liabilities: Accounts Payable Commercial paper and notes payable $166,063 $39,049 $121,222 $246,688 Accrued Expenses: Payrolls Taxes and other taxes on income Restructuring Other $35,310 $14,872 $37,187 $21,639 $47,799 $118,976 $115,070 Long-term debt maturing within one year Taxes on Income $39,000 $18,384 $41,496 $42,395 Total Current Liabilities $488,097 $617,053 Long-term Debt Deferred Income Tax Other Obligations $745,957 $221,700 $29,167 $571,199 $216,600 $16,601 $129 $209,738 Stockholder's Equity: Preferred Stock Common Stock Capital received in exces of value Deferred currency translation Reinvested Earnings Total Stockholder's Equity $68 $206,530 $5,410 -$9,077 $406,902 $609,833 -$23,263 $398,011 $584,615 Total Liabilities and equity $2,094,754 $2,006,068 Exhibit 2: USG Corporation Consolidated Statement of Earnings for years ending Dec 31 ($thousands except per-share figures) Net Sales Cost of Product Sold 1987 1986 1985 1984 1983 $2,898,063 $2,723,664 $2,333,387 $2,318,628 $1,611,071 $2,114,424 $1,884,596 $1,641,009 $1,712,936 $1,264,569 Gross Profit $783,639 $839,068 $692,378 $605,692 $346,502 Expenses and Other income: SGA Restructuring Expense Interest Expense Interest income Gain on offering stock Other expense(income) $ 344,410.00 $ 310,874.00 $ 251,164.00 $ 239,644.00 $ 185,581.00 $ 53,564.00 $ 70,257.00 $ 34,850.00 $ 27,804.00 $ 26,475.00 $ 11,117.00 $ (6,510.00) $ (6,949.00) $ (9,447.00) $ (7,947.00) $ (7,392.00) $(43,988.00) $ (1,854.00) $ 2,534.00 $ (3,833.00) $ (2,265.00) $10,152.00 Earnings from continuing operations before tax Taxes on Income $367,760 $163,471 $497,759 $242,329 $426,690 $201,443 $349,785 $163,229 $147,044 $66,721 $204,289 $255,430 $225,247 $186,556 $80,323 Earnings from continuing operations Discounted Operations: Operating Loss, net taxes Loss on divestitute, net taxes $ (3,254.00) $ (1,450.00) $ (26,668.00) $204,289 $225,508 $223,797 $186,556 $80,323 Net Earnings Earnings per common share: Continuing Operations Discounted operations Net $ 3.96 $ $ $ 4.01 $ (0.47) $ 3.54 $ 3.38 $ (0.02) $ 3.36 $ 2.82 $ 0.12 $ 2.94 $ 1.19 0.01 1.20 $ 3.96 51.6 63.6 66.6 66 66.9 Average # of shares outstanding Closing stock price (12/31) Dividends per common share Book Value per share $29.13 $1.12 $11.76 $37.75 $1.04 $11.06 $25.31 $0.84 $15.08 $14.85 $0.70 $12.87 $14.81 $0.61 $10.97 21,700 20,100 18,000 22,200 1.37 Number of employees Equity Beta 14,000
Step by Step Solution
There are 3 Steps involved in it
Step: 1

Get Instant Access to Expert-Tailored Solutions
See step-by-step solutions with expert insights and AI powered tools for academic success
Step: 2

Step: 3
Ace Your Homework with AI
Get the answers you need in no time with our AI-driven, step-by-step assistance
Get Started
Applied Valuation A Pragmatic Approach
Authors: Clifford S. Ang
1st Edition
3110771748,3110771837