

Question
2. We want to create a one variable data table that will display values of Taxable Income (cell O3), versus Federal Tax (cell F18) and
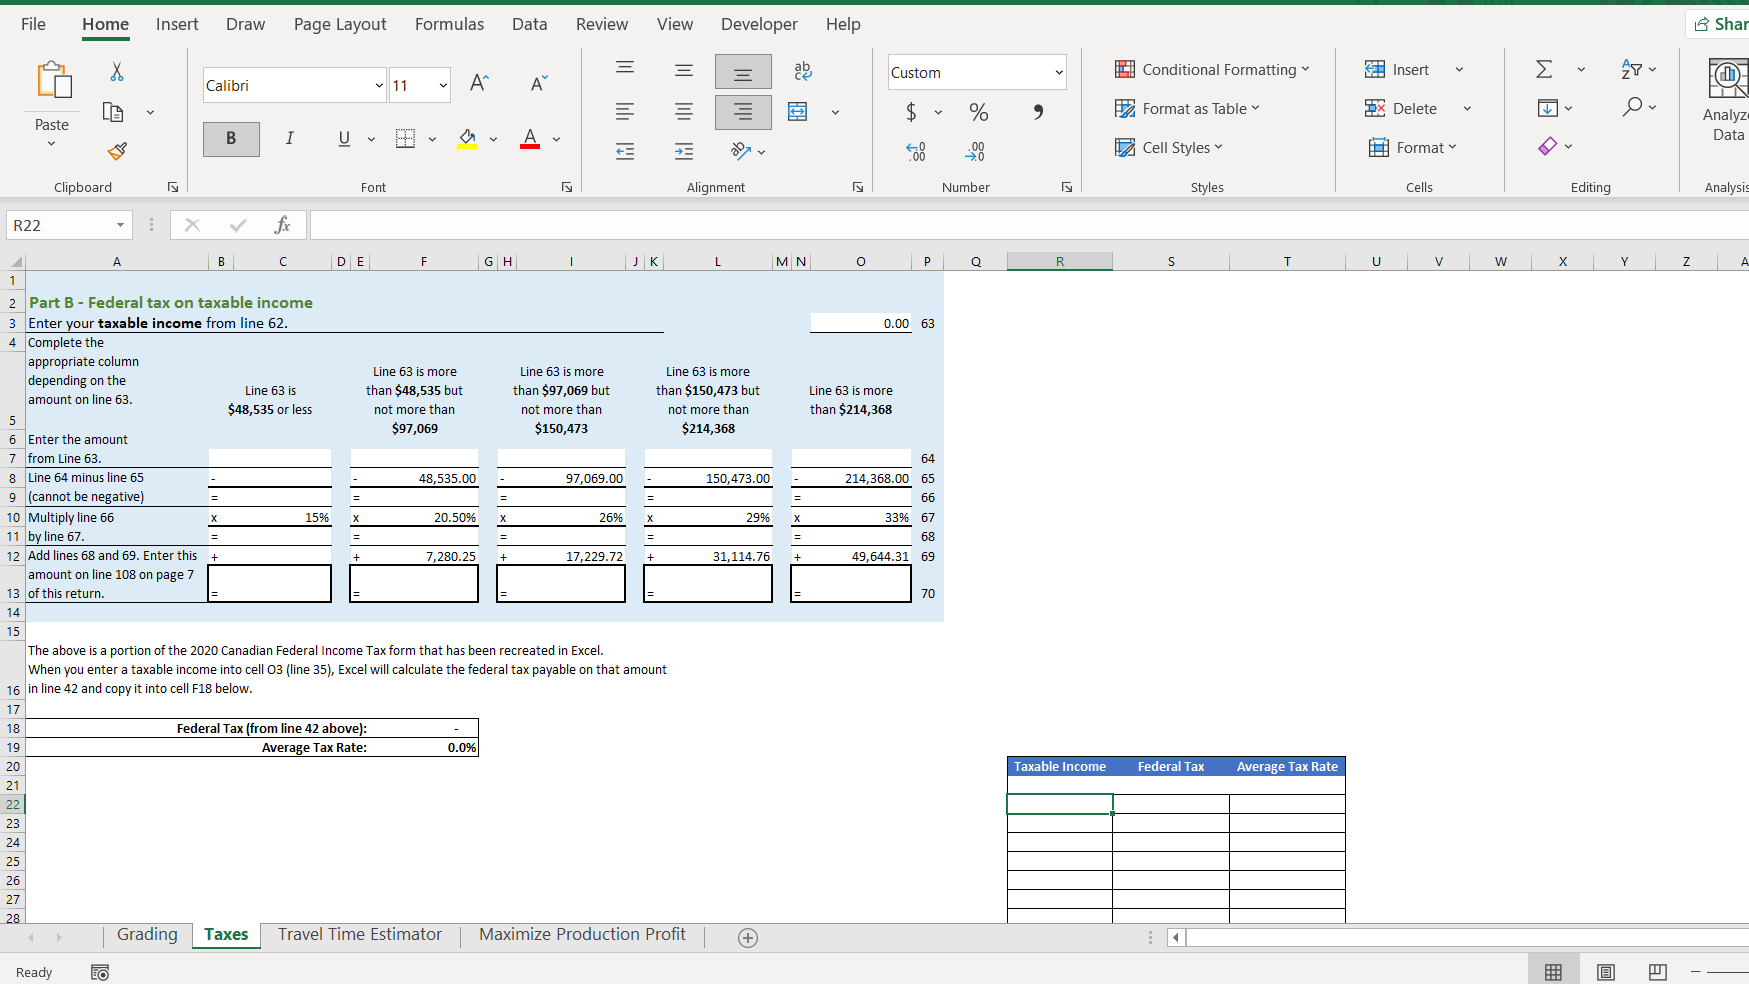
2. We want to create a one variable data table that will display values of Taxable Income (cell O3), versus Federal Tax (cell F18) and Average Tax Rate (cell F19). Begin by filling in the range of Taxable Income values of 0 through 250,000, in increments of 10,000, starting at cell R22.
3. Enter references for the Federal Tax (cell F18), and the Average Tax Rate (cell F19) into the appropriate locations in the data table to include them in the table results.
4. Complete the one variable data table to display both the Federal Tax and the Average Tax Rate for the corresponding values of Taxable Income.
5. Create a Goal Seek that will adjust the Taxable Income in cell O3 to obtain an Average Tax Rate of 20% in cell F19. Because we are only looking for a rounded value of 20% there are many values in O3 that will provide this result. The starting value of O3 will determine the final value selected for O3 by Goal Seek. So, to obtain the answer your instructor is expecting, you must enter a value of 0 for the Taxable Income in cell O3 before doing the goal seek. Do not change the value of O3 after the Goal Seek is complete or your answer will be lost.
If you could show steps that would be great. Thank You!
File Home Insert Draw Page Layout Formulas Data Review View Developer Help Shar ab Custom = 1 Conditional Formatting # Insert v Calibri . FO 11 A = = $ % 14 Format as Table 3X Delete Lv Analyze Paste B I U A Data lil + Coo Cell Styles Format Clipboard Font Alignment Number Styles Cells Editing Analysis R22 fx R S T U V w X Y Z x A B C DE F G H J K L MN O P 1 2 Part B - Federal tax on taxable income 3 Enter your taxable income from line 62. 0.00 63 4 Complete the appropriate column Line 63 is more Line 63 is more Line 63 is more depending on the Line 63 is than $48,535 but than $97,069 but than $150,473 but Line 63 is more amount on line 63. $48,535 or less not more than not more than not more than than $214,368 5 $97,069 $150,473 $214,368 6 Enter the amount 7 from Line 63. 64 8 Line 64 minus line 65 48,535.00 97,069.00 150,473.00 214,368.00 65 9 (cannot be negative) 66 10 Multiply line 66 X 15% 20.50% 26% 29% 33% 67 11 by line 67. 68 12 Add lines 68 and 69. Enter this 7,280.25 17,229.72 31,114.76 49,644.31 69 amount on line 108 on page 7 13 of this return. 70 14 15 The above is a portion of the 2020 Canadian Federal Income Tax form that has been recreated in Excel. When you enter a taxable income into cell 03 (line 35), Excel will calculate the federal tax payable on that amount 16 in line 42 and copy it into cell F18 below. 17 18 Federal Tax (from line 42 above): 19 Average Tax Rate: 0.0% 20 21 22 23 24 25 26 27 28 Grading Taxes Travel Time Estimator Maximize Production Profit + Taxable income Federal Tax Average Tax Rate Ready File Home Insert Draw Page Layout Formulas Data Review View Developer Help Shar ab Custom = 1 Conditional Formatting # Insert v Calibri . FO 11 A = = $ % 14 Format as Table 3X Delete Lv Analyze Paste B I U A Data lil + Coo Cell Styles Format Clipboard Font Alignment Number Styles Cells Editing Analysis R22 fx R S T U V w X Y Z x A B C DE F G H J K L MN O P 1 2 Part B - Federal tax on taxable income 3 Enter your taxable income from line 62. 0.00 63 4 Complete the appropriate column Line 63 is more Line 63 is more Line 63 is more depending on the Line 63 is than $48,535 but than $97,069 but than $150,473 but Line 63 is more amount on line 63. $48,535 or less not more than not more than not more than than $214,368 5 $97,069 $150,473 $214,368 6 Enter the amount 7 from Line 63. 64 8 Line 64 minus line 65 48,535.00 97,069.00 150,473.00 214,368.00 65 9 (cannot be negative) 66 10 Multiply line 66 X 15% 20.50% 26% 29% 33% 67 11 by line 67. 68 12 Add lines 68 and 69. Enter this 7,280.25 17,229.72 31,114.76 49,644.31 69 amount on line 108 on page 7 13 of this return. 70 14 15 The above is a portion of the 2020 Canadian Federal Income Tax form that has been recreated in Excel. When you enter a taxable income into cell 03 (line 35), Excel will calculate the federal tax payable on that amount 16 in line 42 and copy it into cell F18 below. 17 18 Federal Tax (from line 42 above): 19 Average Tax Rate: 0.0% 20 21 22 23 24 25 26 27 28 Grading Taxes Travel Time Estimator Maximize Production Profit + Taxable income Federal Tax Average Tax Rate ReadyStep by Step Solution
There are 3 Steps involved in it
Step: 1

Get Instant Access to Expert-Tailored Solutions
See step-by-step solutions with expert insights and AI powered tools for academic success
Step: 2

Step: 3
Ace Your Homework with AI
Get the answers you need in no time with our AI-driven, step-by-step assistance
Get Started
Risk Management In Organizations An Integrated Case Study Approach
Authors: Margaret Woods
1st Edition
0415591732, 9780415591737