

Answered step by step
Verified Expert Solution
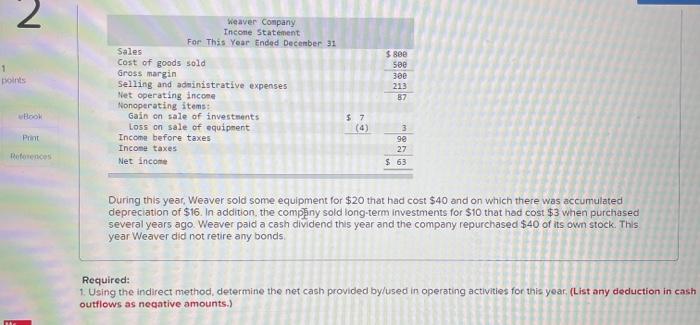
Question
1 Approved Answer
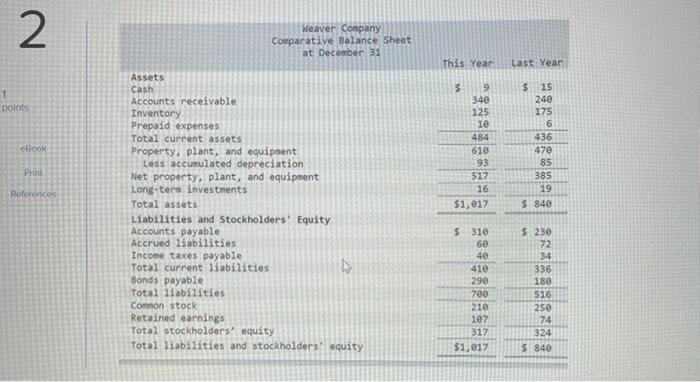
2 Weaver Company Comparative Balance Sheet at December 31 This Year Last Year 1 points BOOM $ 9 340 125 10 484 610 93 517
Step by Step Solution
There are 3 Steps involved in it
Step: 1

Get Instant Access to Expert-Tailored Solutions
See step-by-step solutions with expert insights and AI powered tools for academic success
Step: 2

Step: 3
Ace Your Homework with AI
Get the answers you need in no time with our AI-driven, step-by-step assistance
Get Started
Murder Audit
Authors: Michelle Cornish
1st Edition
1775083624, 978-1775083627