Answered step by step
Verified Expert Solution
Question
1 Approved Answer
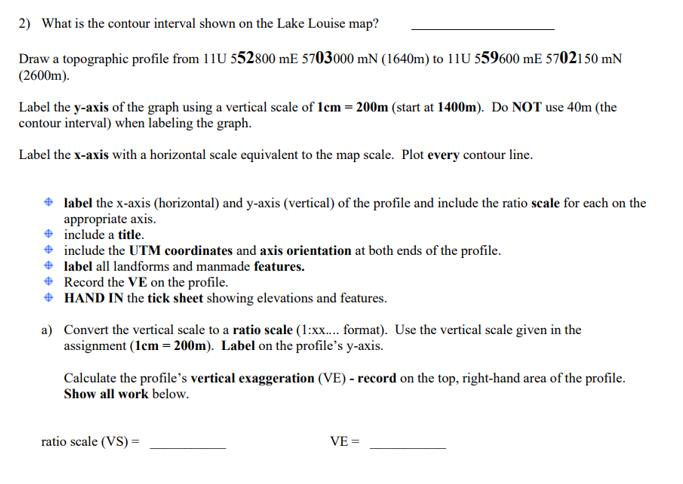
2) What is the contour interval shown on the Lake Louise map? Draw a topographic profile from 11U 552800 mE 5703000 mN (1640m) to

2) What is the contour interval shown on the Lake Louise map? Draw a topographic profile from 11U 552800 mE 5703000 mN (1640m) to 11U 559600 mE 5702150 mN (2600m). Label the y-axis of the graph using a vertical scale of 1cm = 200m (start at 1400m). Do NOT use 40m (the contour interval) when labeling the graph. Label the x-axis with a horizontal scale equivalent to the map scale. Plot every contour line. label the x-axis (horizontal) and y-axis (vertical) of the profile and include the ratio scale for each on the appropriate axis. include a title. include the UTM coordinates and axis orientation at both ends of the profile. label all landforms and manmade features. Record the VE on the profile. + HAND IN the tick sheet showing elevations and features. a) Convert the vertical scale to a ratio scale (1:xx.... format). Use the vertical scale given in the assignment (1cm=200m). Label on the profile's y-axis. Calculate the profile's vertical exaggeration (VE) - record on the top, right-hand area of the profile. Show all work below. ratio scale (VS) = VE=
Step by Step Solution
There are 3 Steps involved in it
Step: 1

Get Instant Access to Expert-Tailored Solutions
See step-by-step solutions with expert insights and AI powered tools for academic success
Step: 2

Step: 3

Ace Your Homework with AI
Get the answers you need in no time with our AI-driven, step-by-step assistance
Get Started


