Answered step by step
Verified Expert Solution
Link Copied!

Question

1 Approved Answer

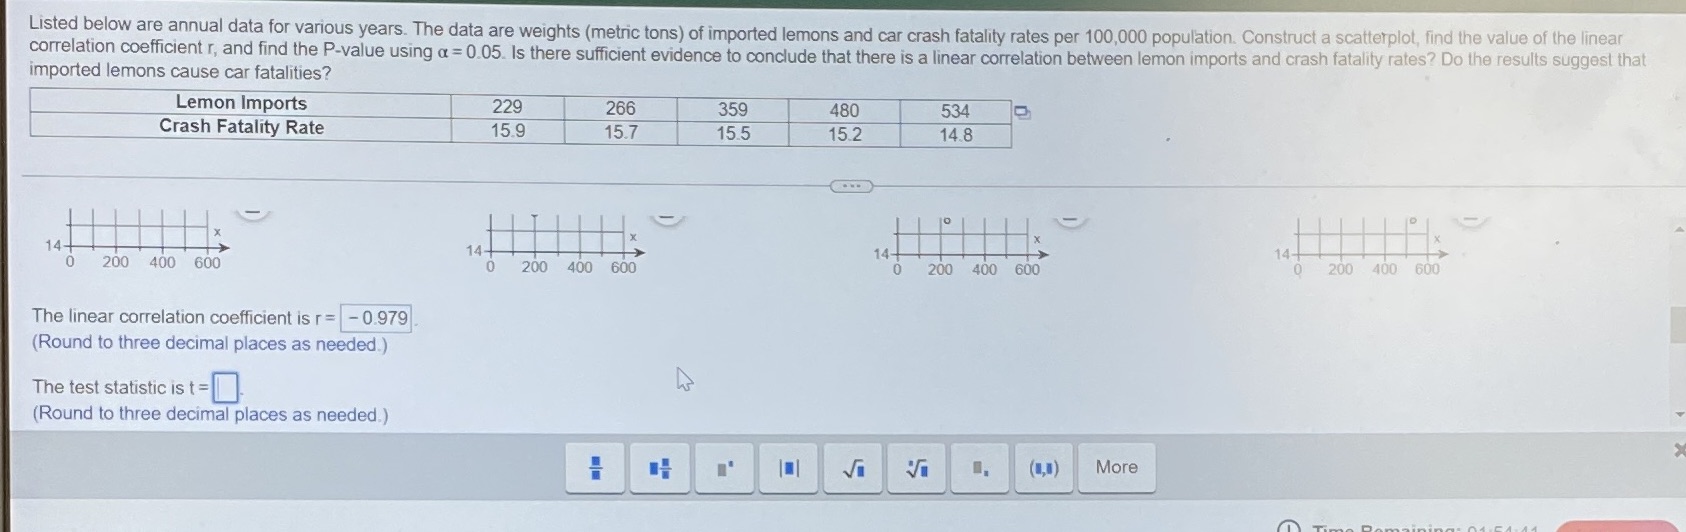
2. What's the test statistic? Listed below are annual data for various years. The data are weights (metric tons) of imported lemons and car crash

2. What's the test statistic?

image text in transcribed
Listed below are annual data for various years. The data are weights (metric tons) of imported lemons and car crash fatality rates per 100,000 population. Construct a scatterplot, find the value of the linear correlation coefficient r, and find the P-value using a = 0.05. Is there sufficient evidence to conclude that there is a linear correlation between lemon imports and crash fatality rates? Do the results suggest that imported lemons cause car fatalities? Lemon Imports 229 266 359 480 534 Crash Fatality Rate 15.9 15.7 15.5 15.2 14.8 x 200 400 600 14 14+ 200 400 600 O 200 400 600 200 400 600 The linear correlation coefficient is r = - 0.979 (Round to three decimal places as needed.) The test statistic ist =] (Round to three decimal places as needed.) VI More

Step by Step Solution

There are 3 Steps involved in it

Step: 1

blur-text-image

Get Instant Access to Expert-Tailored Solutions

See step-by-step solutions with expert insights and AI powered tools for academic success

Step: 2

blur-text-image

Step: 3

blur-text-image

Ace Your Homework with AI

Get the answers you need in no time with our AI-driven, step-by-step assistance

Get Started

Recommended Textbook for

Spherical Radial Basis Functions, Theory And Applications

Authors: Simon Hubbert, Quoc Thong Le Gia, Tanya M Morton

1st Edition

331917939X, 9783319179391

More Books

Students also viewed these Mathematics questions