

Answered step by step
Verified Expert Solution
Question
1 Approved Answer
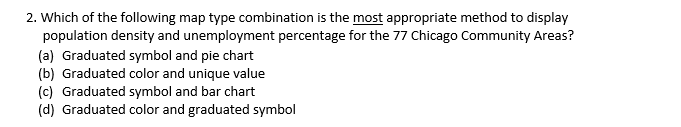
2. Which of the following map type combination is the most appropriate method to display population density and unemployment percentage for the 77 Chicago Community
Step by Step Solution
There are 3 Steps involved in it
Step: 1

Get Instant Access to Expert-Tailored Solutions
See step-by-step solutions with expert insights and AI powered tools for academic success
Step: 2

Step: 3
Ace Your Homework with AI
Get the answers you need in no time with our AI-driven, step-by-step assistance
Get Started
The Accidental Data Scientist
Authors: Amy Affelt
1st Edition
1573877077, 9781573877077