

Answered step by step
Verified Expert Solution
Question
1 Approved Answer
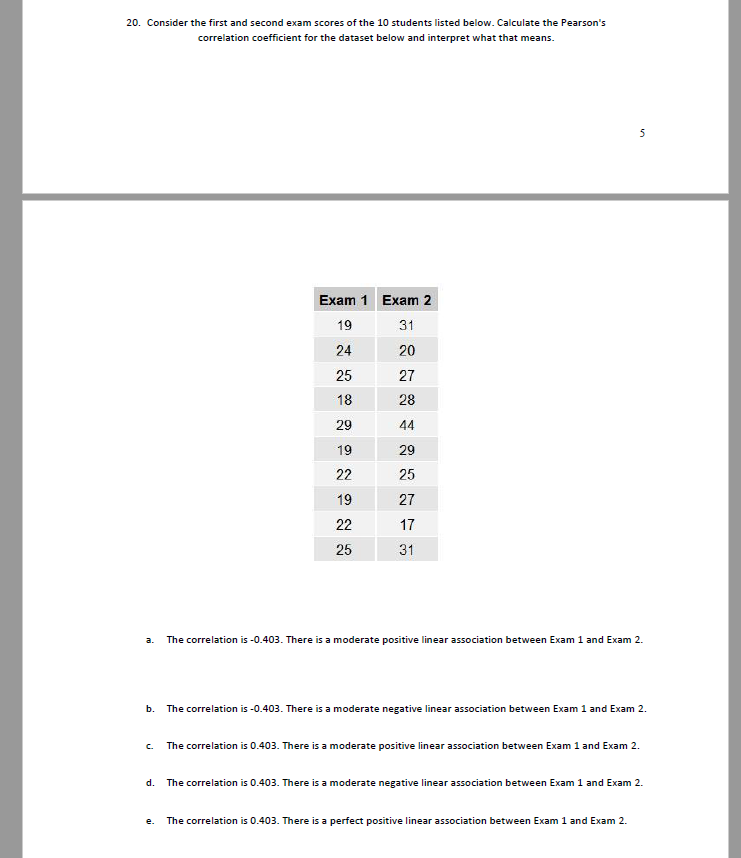
20 . Consider the first and second exam scores of the 10 students listed below . Calculate the Pearson's correlation coefficient for the dataset below
Step by Step Solution
There are 3 Steps involved in it
Step: 1

Get Instant Access to Expert-Tailored Solutions
See step-by-step solutions with expert insights and AI powered tools for academic success
Step: 2

Step: 3
Ace Your Homework with AI
Get the answers you need in no time with our AI-driven, step-by-step assistance
Get Started
Algebra and Trigonometry
Authors: Ron Larson
10th edition
9781337514255, 1337271179, 133751425X, 978-1337271172