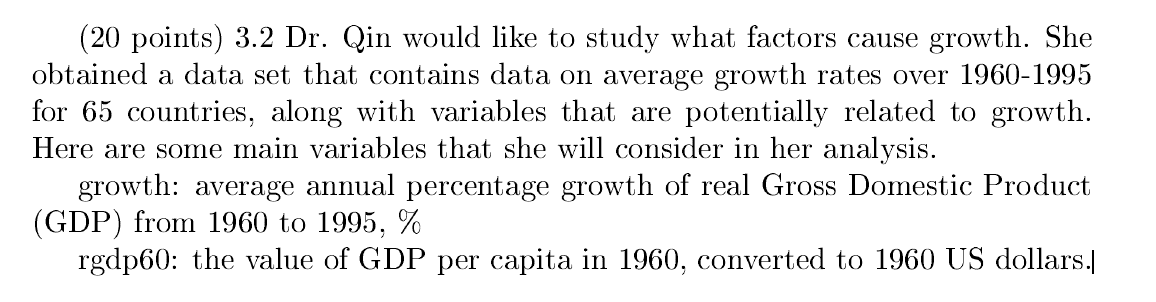
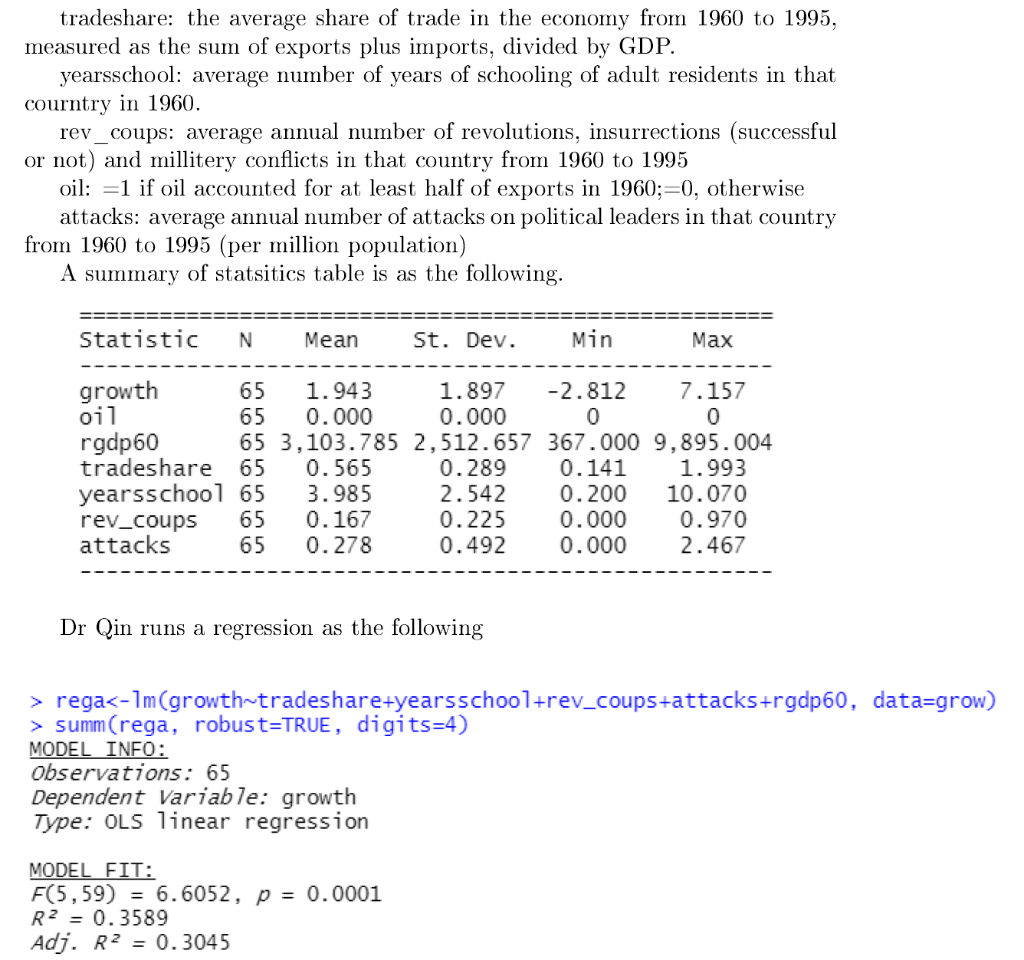
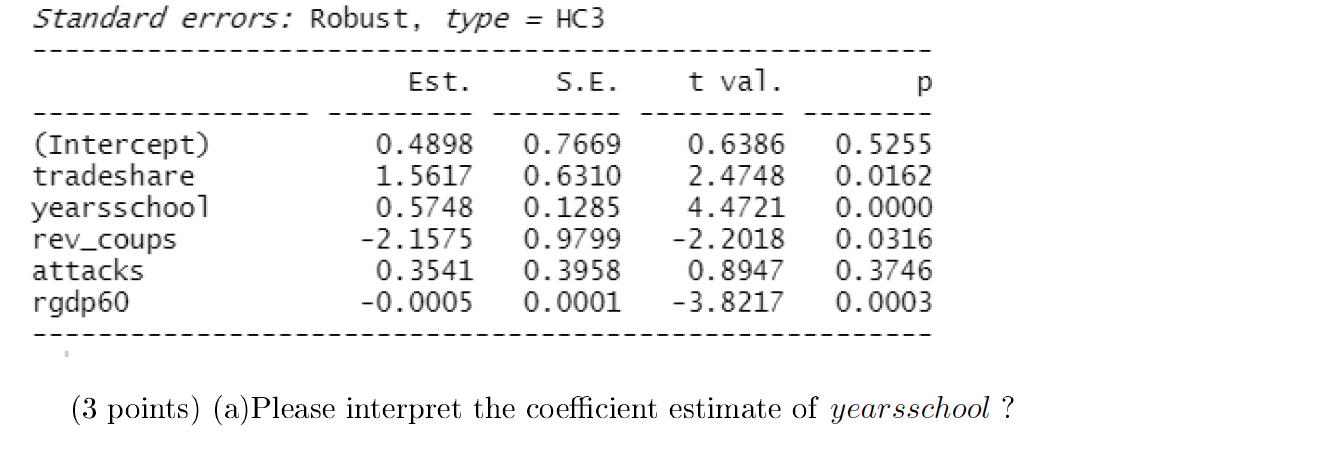
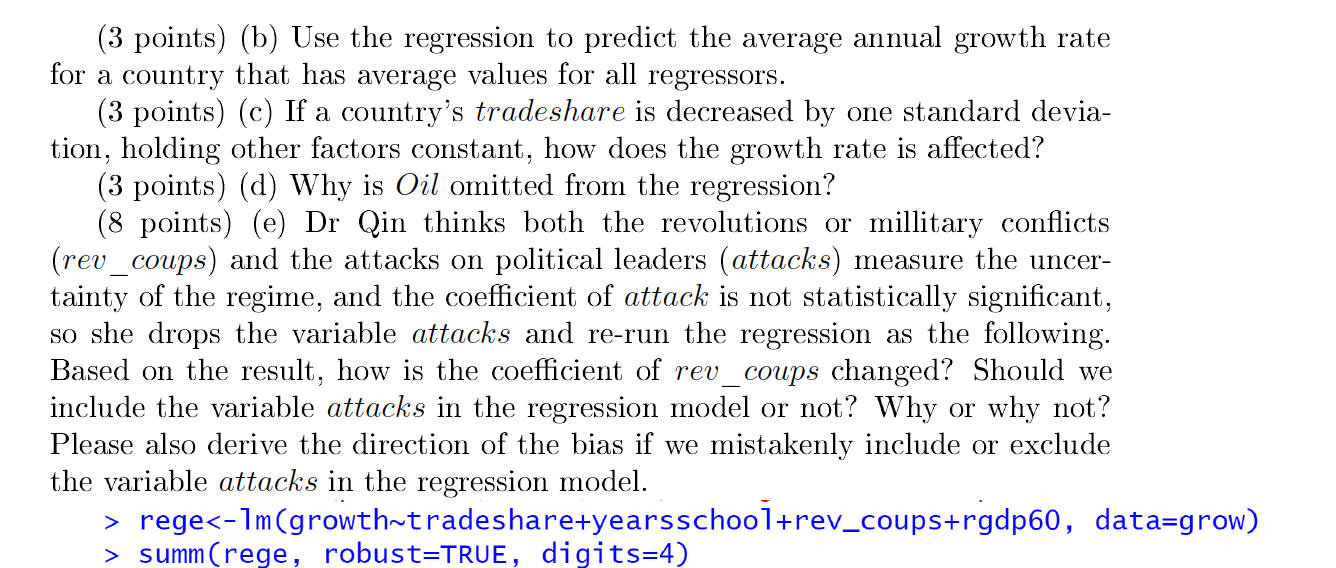
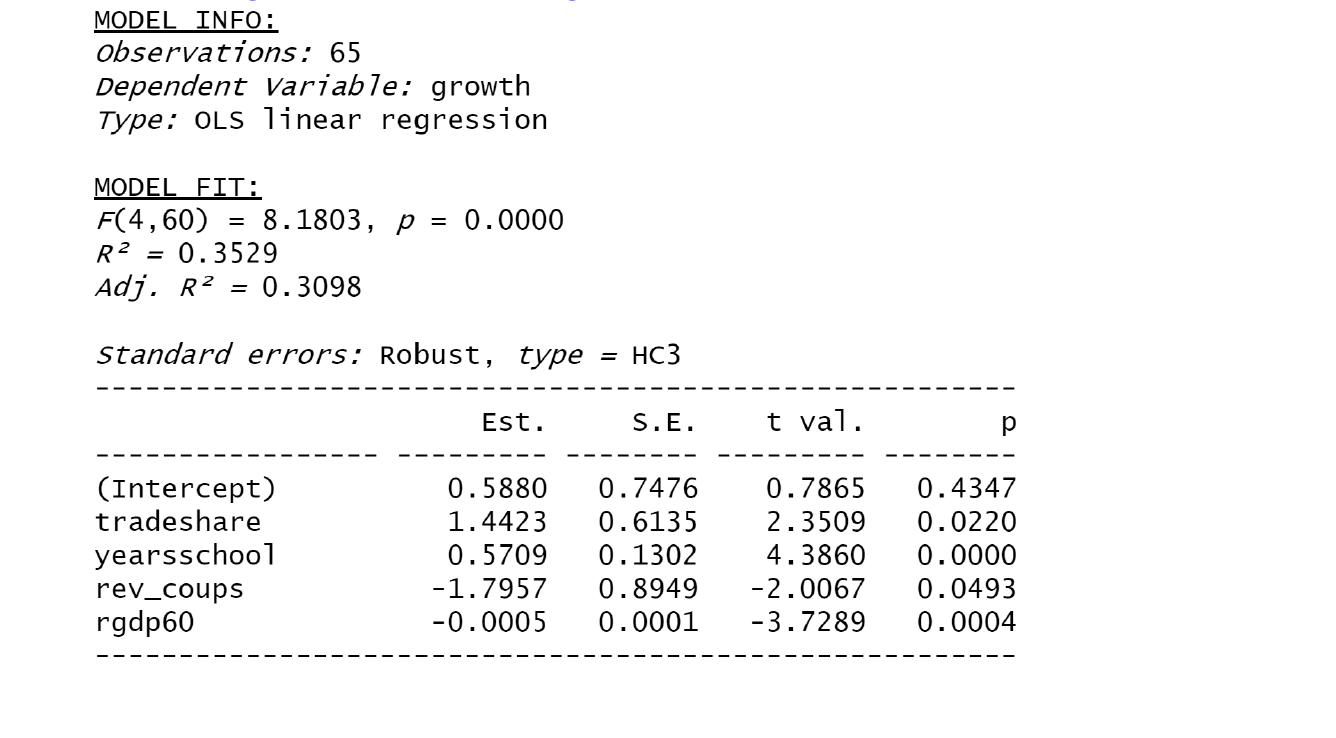
(20 points) 3.2 Dr. Qin would like to study what factors cause growth. She obtained a data set that contains data on average growth rates over 1960-1995 for 65 countries, along with variables that are potentially related to growth. Here are some main variables that she will consider in her analysis. growth: average annual percentage growth of real Gross Domestic Product (GDP) from 1960 to 1995, % rgdp60: the value of GDP per capita in 1960, converted to 1960 US dollars. tradeshare: the average share of trade in the economy from 1960 to 1995, measured as the sum of exports plus imports, divided by GDP. yearsschool: average number of years of schooling of adult residents in that courntry in 1960. rev _coups: average annual number of revolutions, insurrections (successful or not) and millitery conflicts in that country from 1960 to 1995 oil: =1 if oil accounted for at least half of exports in 1960;=0, otherwise attacks: average annual number of attacks on political leaders in that country from 1960 to 1995 (per million population) A summary of statsitics table is as the following. Statistic N Mean St. Dev. Min Max growth 65 1.943 1.897 -2.812 7.157 oil 65 0.000 0.000 0 0 rgdp60 65 3, 103.785 2,512.657 367.000 9,895.004 tradeshare 65 0.565 0.289 0.141 1.993 yearsschool 65 3.985 2.542 0.200 10.070 rev_coups 65 0.167 0.225 0.000 0.970 attacks 65 0.278 0.492 0.000 2.467 Dr Qin runs a regression as the following > rega summ(rega, robust=TRUE, digits=4) MODEL INFO: Observations: 65 Dependent Variable: growth Type: OLS linear regression MODEL FIT: F(5,59) = 6.6052, p = 0.0001 R2 = 0.3589 Adj. R2 = 0.3045 Standard errors: Robust, type = HC3 Est. S.E. t val. (Intercept) tradeshare yearsschool rev_coups attacks rgdp60 0.4898 1.5617 0.5748 -2.1575 0.3541 -0.0005 0.7669 0.6310 0.1285 0.9799 0.3958 0.0001 0.6386 2.4748 4.4721 -2.2018 0.8947 -3.8217 0.5255 0.0162 0.0000 0.0316 0.3746 0.0003 (3 points) (a)Please interpret the coefficient estimate of yearsschool ? (3 points) (b) Use the regression to predict the average annual growth rate for a country that has average values for all regressors. (3 points) (c) If a country's tradeshare is decreased by one standard devia- tion, holding other factors constant, how does the growth rate is affected? (3 points) (d) Why is Oil omitted from the regression? (8 points) (e) Dr Qin thinks both the revolutions or millitary conflicts (rev_coups) and the attacks on political leaders (attacks) measure the uncer- tainty of the regime, and the coefficient of attack is not statistically significant, so she drops the variable attacks and re-run the regression as the following. Based on the result, how is the coefficient of rev_coups changed? Should we include the variable attacks in the regression model or not? Why or why not? Please also derive the direction of the bias if we mistakenly include or exclude the variable attacks in the regression model. > rege summ (rege, robust=TRUE, digits=4) MODEL INFO: observations: 65 Dependent Variable: growth Type: OLS linear regression = MODEL FIT: F(4,60) 8.1803, p = 0.0000 R2 = 0.3529 Adj. R2 0.3098 = Standard errors: Robust, type = HC3 Est. S.E. t val. p (Intercept) tradeshare yearsschool rev_coups rgdp60 0.5880 1.4423 0.5709 -1.7957 -0.0005 0.7476 0.6135 0.1302 0.8949 0.0001 0.7865 2.3509 4.3860 -2.0067 -3.7289 0.4347 0.0220 0.0000 0.0493 0.0004 (20 points) 3.2 Dr. Qin would like to study what factors cause growth. She obtained a data set that contains data on average growth rates over 1960-1995 for 65 countries, along with variables that are potentially related to growth. Here are some main variables that she will consider in her analysis. growth: average annual percentage growth of real Gross Domestic Product (GDP) from 1960 to 1995, % rgdp60: the value of GDP per capita in 1960, converted to 1960 US dollars. tradeshare: the average share of trade in the economy from 1960 to 1995, measured as the sum of exports plus imports, divided by GDP. yearsschool: average number of years of schooling of adult residents in that courntry in 1960. rev _coups: average annual number of revolutions, insurrections (successful or not) and millitery conflicts in that country from 1960 to 1995 oil: =1 if oil accounted for at least half of exports in 1960;=0, otherwise attacks: average annual number of attacks on political leaders in that country from 1960 to 1995 (per million population) A summary of statsitics table is as the following. Statistic N Mean St. Dev. Min Max growth 65 1.943 1.897 -2.812 7.157 oil 65 0.000 0.000 0 0 rgdp60 65 3, 103.785 2,512.657 367.000 9,895.004 tradeshare 65 0.565 0.289 0.141 1.993 yearsschool 65 3.985 2.542 0.200 10.070 rev_coups 65 0.167 0.225 0.000 0.970 attacks 65 0.278 0.492 0.000 2.467 Dr Qin runs a regression as the following > rega summ(rega, robust=TRUE, digits=4) MODEL INFO: Observations: 65 Dependent Variable: growth Type: OLS linear regression MODEL FIT: F(5,59) = 6.6052, p = 0.0001 R2 = 0.3589 Adj. R2 = 0.3045 Standard errors: Robust, type = HC3 Est. S.E. t val. (Intercept) tradeshare yearsschool rev_coups attacks rgdp60 0.4898 1.5617 0.5748 -2.1575 0.3541 -0.0005 0.7669 0.6310 0.1285 0.9799 0.3958 0.0001 0.6386 2.4748 4.4721 -2.2018 0.8947 -3.8217 0.5255 0.0162 0.0000 0.0316 0.3746 0.0003 (3 points) (a)Please interpret the coefficient estimate of yearsschool ? (3 points) (b) Use the regression to predict the average annual growth rate for a country that has average values for all regressors. (3 points) (c) If a country's tradeshare is decreased by one standard devia- tion, holding other factors constant, how does the growth rate is affected? (3 points) (d) Why is Oil omitted from the regression? (8 points) (e) Dr Qin thinks both the revolutions or millitary conflicts (rev_coups) and the attacks on political leaders (attacks) measure the uncer- tainty of the regime, and the coefficient of attack is not statistically significant, so she drops the variable attacks and re-run the regression as the following. Based on the result, how is the coefficient of rev_coups changed? Should we include the variable attacks in the regression model or not? Why or why not? Please also derive the direction of the bias if we mistakenly include or exclude the variable attacks in the regression model. > rege summ (rege, robust=TRUE, digits=4) MODEL INFO: observations: 65 Dependent Variable: growth Type: OLS linear regression = MODEL FIT: F(4,60) 8.1803, p = 0.0000 R2 = 0.3529 Adj. R2 0.3098 = Standard errors: Robust, type = HC3 Est. S.E. t val. p (Intercept) tradeshare yearsschool rev_coups rgdp60 0.5880 1.4423 0.5709 -1.7957 -0.0005 0.7476 0.6135 0.1302 0.8949 0.0001 0.7865 2.3509 4.3860 -2.0067 -3.7289 0.4347 0.0220 0.0000 0.0493 0.0004