Answered step by step
Verified Expert Solution
Question
1 Approved Answer
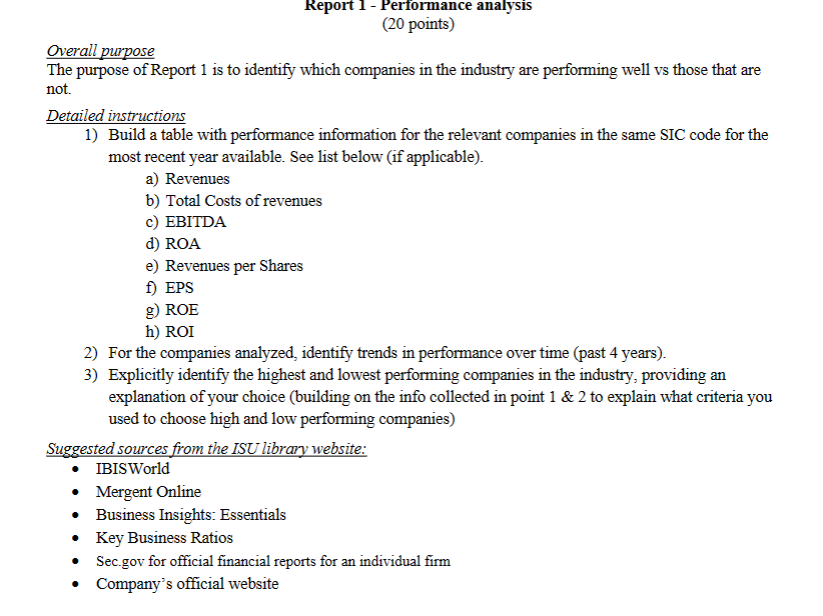
(20 points) Overall purpose The purpose of Report 1 is to identify which companies in the industry are performing well vs those that are not.

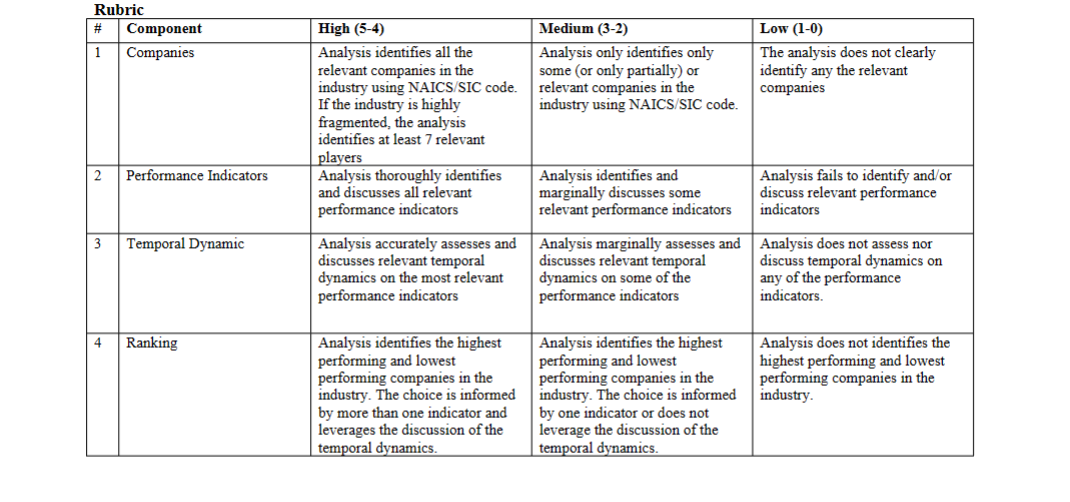
 (20 points) Overall purpose The purpose of Report 1 is to identify which companies in the industry are performing well vs those that are not. Detailed instructions 1) Build a table with performance information for the relevant companies in the same SIC code for the most recent year available. See list below (if applicable). a) Revenues b) Total Costs of revenues c) EBITDA d) ROA e) Revenues per Shares f) EPS g) ROE h) ROI 2) For the companies analyzed, identify trends in performance over time (past 4 years). 3) Explicitly identify the highest and lowest performing companies in the industry, providing an explanation of your choice (building on the info collected in point 1&2 to explain what criteria you used to choose high and low performing companies) Suggested sources from the ISU library website: - IBISWorld - Mergent Online - Business Insights: Essentials - Key Business Ratios - Sec.gov for official financial reports for an individual firm - Company's official website Rubric \begin{tabular}{|l|l|l|l|l|} \hline# & Component & High (5-4) & Medium (3-2) & Low (1-0) \\ \hline 1 & Companies & \begin{tabular}{l} Analysis identifies all the \\ relevant companies in the \\ industry using NAICS/SIC code. \\ If the industry is highly \\ fragmented, the analysis \\ identifies at least 7 relevant \\ players \end{tabular} & \begin{tabular}{l} Analysis only identifies only \\ some (or only partially) or \\ relevant companies in the \\ industry using NAICS/SIC code. \end{tabular} & \begin{tabular}{l} The analysis does not clearly \\ identify any the relevant \\ companies \end{tabular} \\ \hline 2 & Performance Indicators & \begin{tabular}{l} Analysis thoroughly identifies \\ and discusses all relevant \\ performance indicators \end{tabular} & \begin{tabular}{l} Analysis identifies and \\ marginally discusses some \\ relevant performance indicators \end{tabular} & \begin{tabular}{l} Analysis fails to identify and/or \\ discuss relevant performance \\ indicators \end{tabular} \\ \hline 3 & Temporal Dynamic & \begin{tabular}{l} Analysis accurately assesses and \\ discusses relevant temporal \\ dynamics on the most relevant \\ performance indicators \end{tabular} & \begin{tabular}{l} Analysis marginally assesses and \\ discusses relevant temporal \\ dynamics on some of the \\ performance indicators \end{tabular} & \begin{tabular}{l} Analysis does not assess nor \\ discuss temporal dynamics on \\ any of the performance \\ indicators. \end{tabular} \\ \hline 4 & Ranking & \begin{tabular}{l} Analysis identifies the highest \\ performing and lowest \\ performing companies in the \\ industry. The choice is informed \\ by more than one indicator and \\ leverages the discussion of the \\ temporal dynamics. \end{tabular} & \begin{tabular}{l} Analysis identifies the highest \\ performing and lowest \\ performing companies in the \\ industry. The choice is informed \\ by one indicator or does not \\ leverage the discussion of the \\ temporal dynamics. \end{tabular} & \begin{tabular}{l} Analysis does not identifies the \\ highest performing and lowest \\ performing companies in the \\ industry. \end{tabular} \\ \hline \end{tabular}
 Step by Step Solution
There are 3 Steps involved in it
Step: 1

Get Instant Access to Expert-Tailored Solutions
See step-by-step solutions with expert insights and AI powered tools for academic success
Step: 2

Step: 3

Ace Your Homework with AI
Get the answers you need in no time with our AI-driven, step-by-step assistance
Get Started


