Answered step by step
Verified Expert Solution
Question
1 Approved Answer
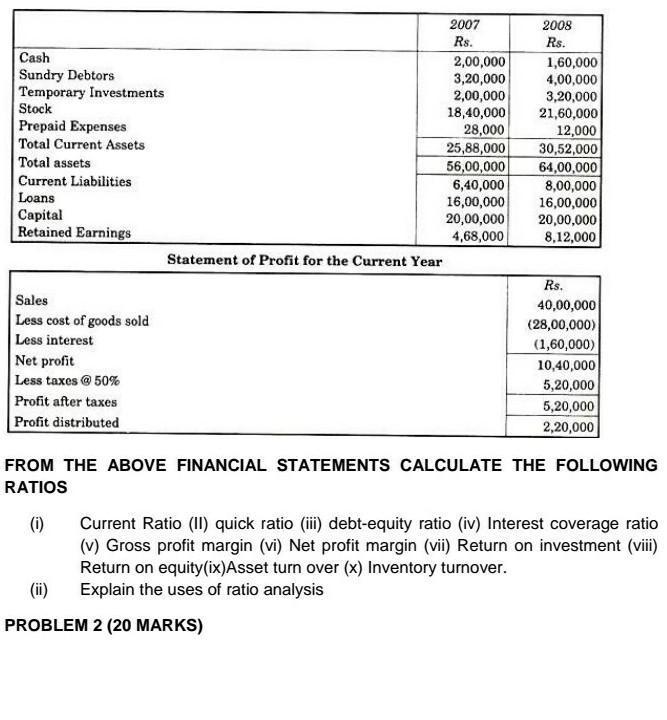
2007 2008 Rs. Rs. Cash Sundry Debtors Temporary Investments Stock Prepaid Expenses Total Current Assets 2,00,000 1,60,000 3,20,000 4,00,000 2,00,000 3,20,000 18,40,000 21,60,000 28,000

2007 2008 Rs. Rs. Cash Sundry Debtors Temporary Investments Stock Prepaid Expenses Total Current Assets 2,00,000 1,60,000 3,20,000 4,00,000 2,00,000 3,20,000 18,40,000 21,60,000 28,000 12,000 25,88,000 30,52,000 Total assets 56,00,000 64,00,000 Current Liabilities 6,40,000 8,00,000 Loans 16,00,000 16,00,000 Capital 20,00,000 20,00,000 Retained Earnings 4,68,000 8,12,000 Statement of Profit for the Current Year Sales Less cost of goods sold Less interest Net profit Less taxes @ 50% Profit after taxes Rs. 40,00,000 (28,00,000) (1,60,000) 10,40,000 5,20,000 5,20,000 2,20,000 Profit distributed FROM THE ABOVE FINANCIAL STATEMENTS CALCULATE THE FOLLOWING RATIOS (i) Current Ratio (II) quick ratio (iii) debt-equity ratio (iv) Interest coverage ratio (v) Gross profit margin (vi) Net profit margin (vii) Return on investment (viii) Return on equity(ix)Asset turn over (x) Inventory turnover. (ii) Explain the uses of ratio analysis PROBLEM 2 (20 MARKS)
Step by Step Solution
There are 3 Steps involved in it
Step: 1

Get Instant Access to Expert-Tailored Solutions
See step-by-step solutions with expert insights and AI powered tools for academic success
Step: 2

Step: 3

Ace Your Homework with AI
Get the answers you need in no time with our AI-driven, step-by-step assistance
Get Started


