

Answered step by step
Verified Expert Solution
Question
1 Approved Answer
2008 2009 2010 2011 2012 2013 2014 2015 2016 2017 2018 2019 - 0.12565 -0.15334 -0.11304 0.20384 -0.20938 0.16692 -0.13762 0.33656 0.02085 -0.07145 -0.09433 -0.32674
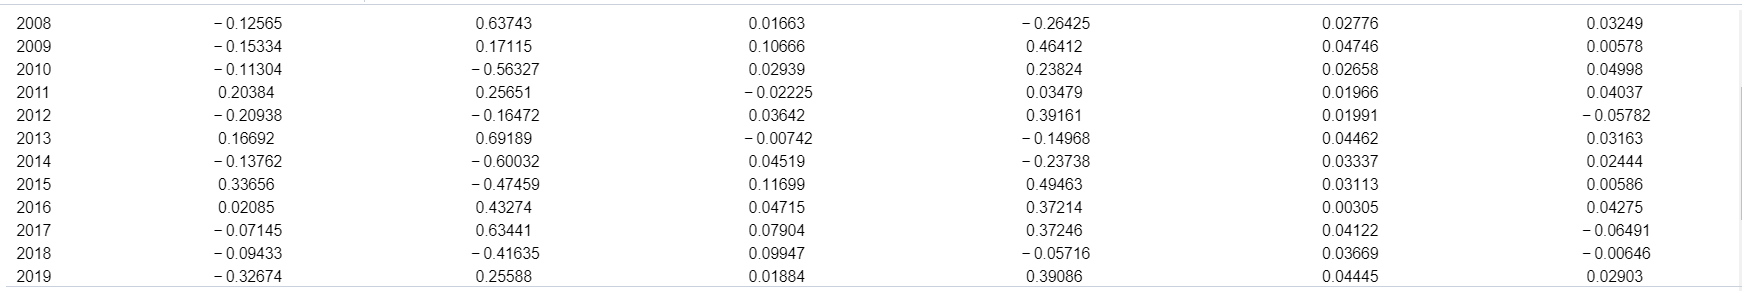


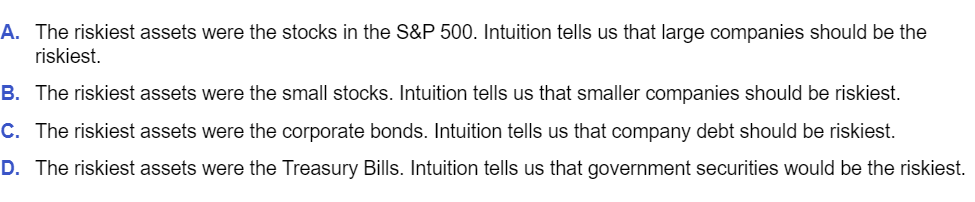
2008 2009 2010 2011 2012 2013 2014 2015 2016 2017 2018 2019 - 0.12565 -0.15334 -0.11304 0.20384 -0.20938 0.16692 -0.13762 0.33656 0.02085 -0.07145 -0.09433 -0.32674 0.63743 0.17115 -0.56327 0.25651 -0.16472 0.69189 -0.60032 -0.47459 0.43274 0.63441 -0.41635 0.25588 0.01663 0.10666 0.02939 -0.02225 0.03642 -0.00742 0.04519 0.11699 0.04715 0.07904 0.09947 0.01884 -0.26425 0.46412 0.23824 0.03479 0.39161 -0.14968 -0.23738 0.49463 0.37214 0.37246 -0.05716 0.39086 0.02776 0.04746 0.02658 0.01966 0.01991 0.04462 0.03337 0.03113 0.00305 0.04122 0.03669 0.04445 0.03249 0.00578 0.04998 0.04037 -0.05782 0.03163 0.02444 0.00586 0.04275 -0.06491 -0.00646 0.02903 Year S&P 500 Small Stocks Corp Bonds World Portfoli CPI 2008 2009 2010 2011 2012 -0.12565 -0.15334 -0.11304 0.20384 -0.20938 16692 0.63743 0.17115 -0.56327 0.25651 -0.16472 069189 0.01663 0.10666 0.02939 -0.02225 0.03642 - 00742 -0.26425 0.46412 0.23824 0.03479 0.39161 - 14968 Treasury Bills 0.02776 0.04746 0.02658 0.01966 0.01991 004462 0.03249 0.00578 0.04998 0.04037 -0.05782 03163 2013 a. Compute the average return for each of the assets from 2008 to 2019. b. Compute the variance and standard deviation for each of the assets from 2008 to 2019. c. Which asset was riskiest during the time between 2008-2019? How does that fit with your intuition? 2008 2009 2010 2011 2012 2013 2014 2015 2016 2017 2018 2019 - 0.12565 -0.15334 -0.11304 0.20384 -0.20938 0.16692 -0.13762 0.33656 0.02085 -0.07145 -0.09433 -0.32674 0.63743 0.17115 -0.56327 0.25651 -0.16472 0.69189 -0.60032 -0.47459 0.43274 0.63441 -0.41635 0.25588 0.01663 0.10666 0.02939 -0.02225 0.03642 -0.00742 0.04519 0.11699 0.04715 0.07904 0.09947 0.01884 -0.26425 0.46412 0.23824 0.03479 0.39161 -0.14968 -0.23738 0.49463 0.37214 0.37246 -0.05716 0.39086 0.02776 0.04746 0.02658 0.01966 0.01991 0.04462 0.03337 0.03113 0.00305 0.04122 0.03669 0.04445 0.03249 0.00578 0.04998 0.04037 -0.05782 0.03163 0.02444 0.00586 0.04275 -0.06491 -0.00646 0.02903 Year S&P 500 Small Stocks Corp Bonds World Portfoli CPI 2008 2009 2010 2011 2012 -0.12565 -0.15334 -0.11304 0.20384 -0.20938 16692 0.63743 0.17115 -0.56327 0.25651 -0.16472 069189 0.01663 0.10666 0.02939 -0.02225 0.03642 - 00742 -0.26425 0.46412 0.23824 0.03479 0.39161 - 14968 Treasury Bills 0.02776 0.04746 0.02658 0.01966 0.01991 004462 0.03249 0.00578 0.04998 0.04037 -0.05782 03163 2013 a. Compute the average return for each of the assets from 2008 to 2019. b. Compute the variance and standard deviation for each of the assets from 2008 to 2019. c. Which asset was riskiest during the time between 2008-2019? How does that fit with your intuition
Step by Step Solution
There are 3 Steps involved in it
Step: 1

Get Instant Access to Expert-Tailored Solutions
See step-by-step solutions with expert insights and AI powered tools for academic success
Step: 2

Step: 3
Ace Your Homework with AI
Get the answers you need in no time with our AI-driven, step-by-step assistance
Get Started
Forward Lease Sukuk In Islamic Capital Markets Structure And Governing Rules
Authors: Ahcene Lahsasna , M. Kabir Hassan , Rubi Ahmad
1st Edition
3319942611,331994262X