

Answered step by step
Verified Expert Solution
Question
1 Approved Answer
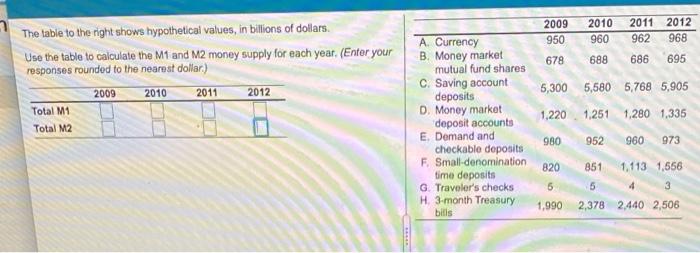
2009 950 2010 960 2011 2012 962 968 678 688 686 695 The table to the right shows hypothetical values, in billions of dollars. Use
Step by Step Solution
There are 3 Steps involved in it
Step: 1

Get Instant Access to Expert-Tailored Solutions
See step-by-step solutions with expert insights and AI powered tools for academic success
Step: 2

Step: 3
Ace Your Homework with AI
Get the answers you need in no time with our AI-driven, step-by-step assistance
Get Started
Capital Failure Rebuilding Trust In Financial Services
Authors: Nicholas Morris , David Vines
1st Edition
0198712227,019102077X