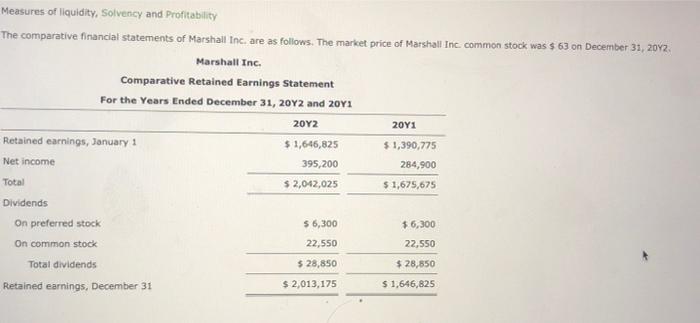
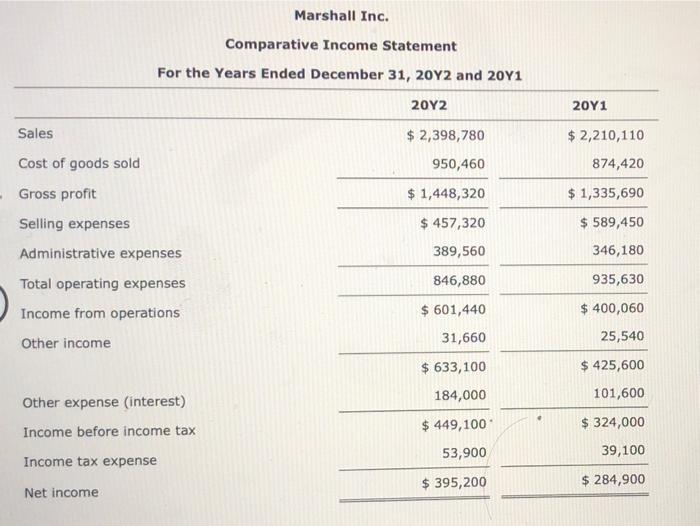
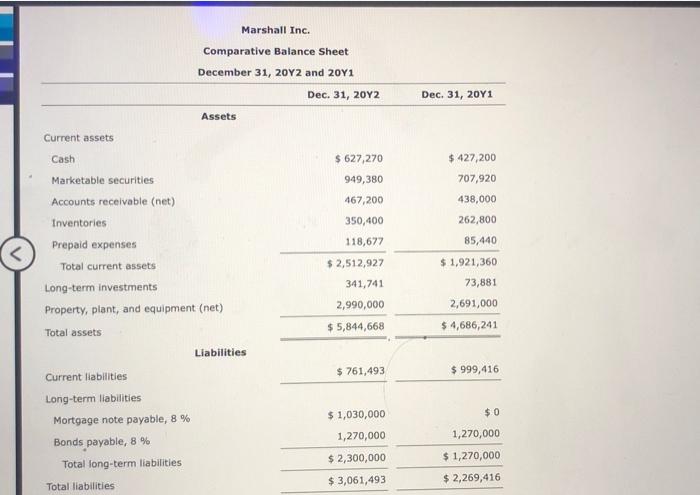
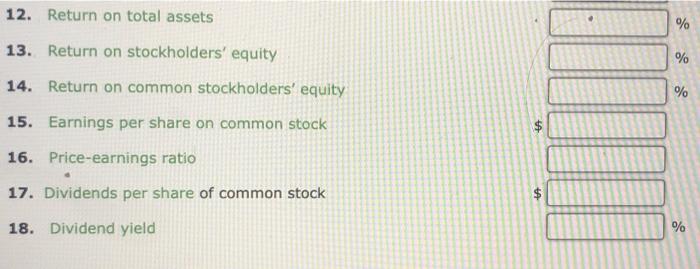
2011 Measures of liquidity, Solvency and Profitability The comparative financial statements of Marshall Inc. are as follows. The market price of Marshall Inc. common stock was $ 63 on December 31, 2012, Marshall Inc. Comparative Retained Earnings Statement For the Years Ended December 31, 2012 and 20Y1 2012 Retained earnings, January 1 $1,646,825 $ 1,390,775 Net income 395,200 284,900 Total $ 2,042,025 $ 1,675,675 Dividends On preferred stock $ 6,300 $ 6,300 On common stock 22,550 Total dividends $ 28,850 Retained earnings, December 31 $ 2,013,175 $1,646,825 22,550 $ 28,850 Marshall Inc. Comparative Income Statement For the Years Ended December 31, 2012 and 2011 2012 2011 Sales $ 2,210,110 $ 2,398,780 950,460 874,420 $ 1,448,320 $ 1,335,690 Cost of goods sold Gross profit Selling expenses Administrative expenses $ 457,320 $ 589,450 389,560 346,180 Total operating expenses 846,880 935,630 $ 601,440 $ 400,060 Income from operations Other income 31,660 25,540 $ 633,100 184,000 Other expense (interest) Income before income tax $ 425,600 101,600 $ 324,000 $ 449,100 53,900 39,100 Income tax expense $ 395,200 $ 284,900 Net income Marshall Inc. Comparative Balance Sheet December 31, 2012 and 2041 Dec. 31, 2012 Assets Dec. 31, 2011 Current assets $ 427,200 $ 627,270 949,380 707,920 467,200 438,000 262,800 350,400 118,677 Cash Marketable securities Accounts receivable (net) Inventories Prepaid expenses Total current assets Long-term investments Property, plant, and equipment (net) Total assets Liabilities $ 2,512,927 341,741 85,440 $ 1,921,360 73,881 2,691,000 $ 4,686,241 2,990,000 $5,844,668 $ 761,493 $ 999,416 Current liabilities Long-term liabilities $ 1,030,000 $0 1,270,000 Mortgage note payable, 8 % Bonds payable, 8 % Total long-term liabilities 1,270,000 $ 1,270,000 $ 2,300,000 $ 3,061,493 Total liabilities $ 2,269,416 $360,000 $360,000 410,000 Stockholders' Equity Preferred $ 0.70 stock, $ 40 par Common stock, $ 10 par Retained earnings Total stockholders' equity Total liabilities and stockholders' equity 410,000 2,013,175 1,646,825 $ 2,416,825 $ 2,783,175 $ 5,844,668 $ 4,686,241 12. Return on total assets % 13. Return on stockholders' equity % % 14. Return on common stockholders' equity 15. Earnings per share on common stock $ 16. Price-earnings ratio $ 17. Dividends per share of common stock 18. Dividend yield %


