Answered step by step
Verified Expert Solution
Question
1 Approved Answer
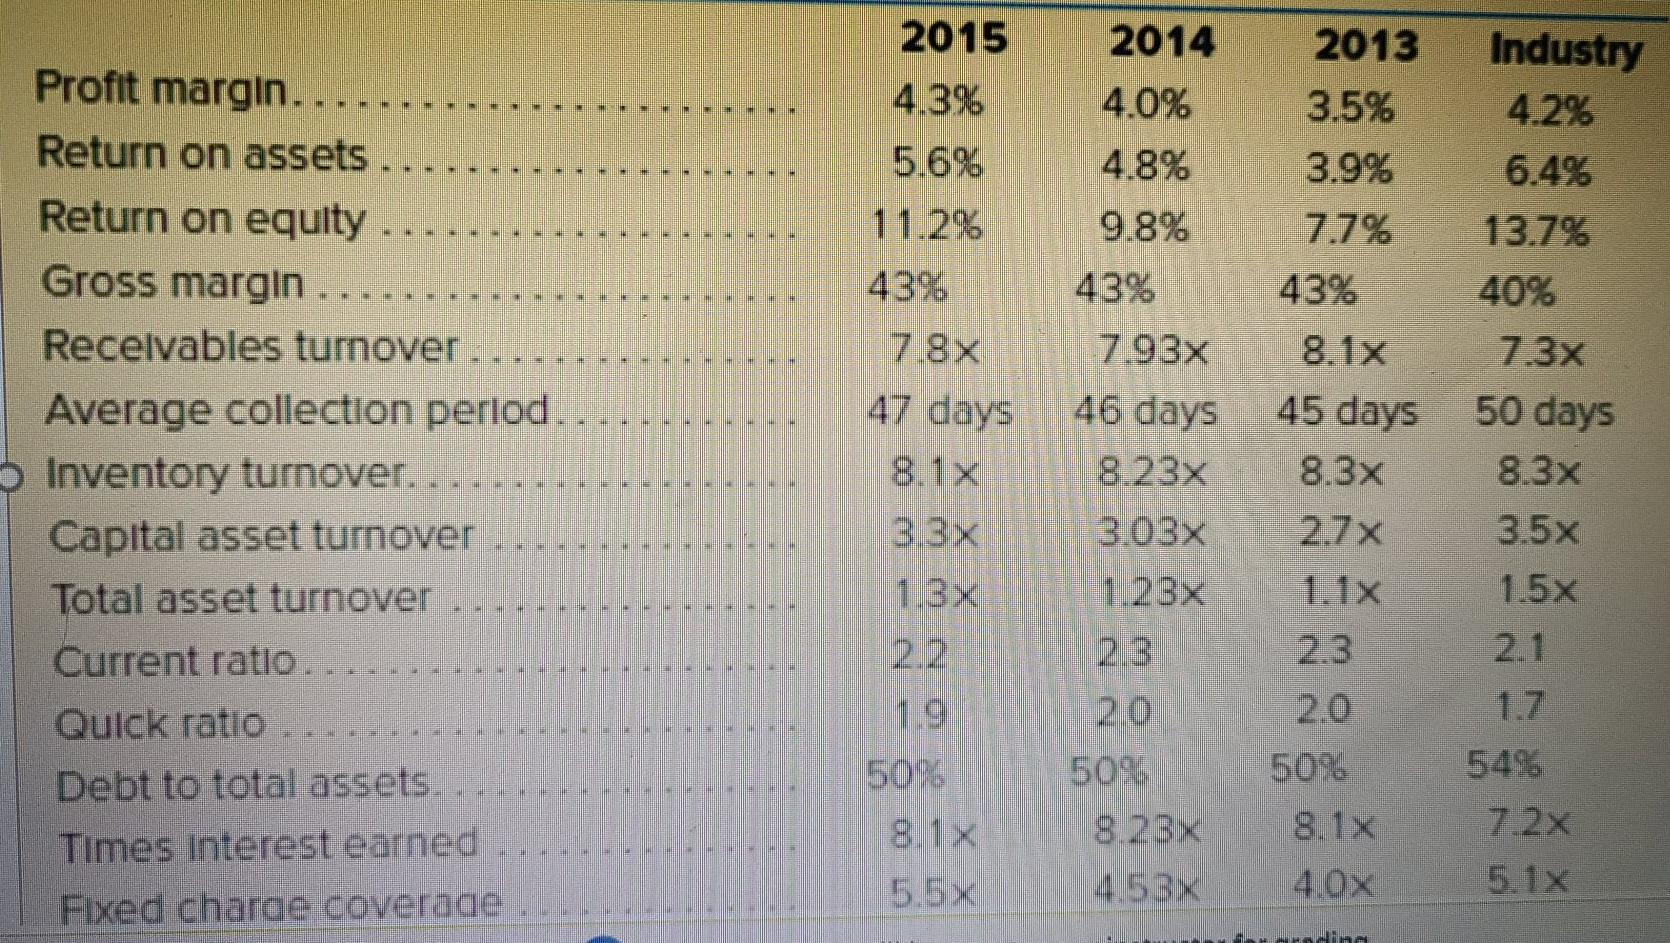
2013 3.5% 3.9% 7.7% 43% 8.1 x 2015 2014 4.3% 4.0% 5.6% 4.8% 11.2% 9.8% 439 43% 7.8 7.93x 47 days 46 days 8.1x1137 8.23x


2013 3.5% 3.9% 7.7% 43% 8.1 x 2015 2014 4.3% 4.0% 5.6% 4.8% 11.2% 9.8% 439 43% 7.8 7.93x 47 days 46 days 8.1x1137 8.23x 3.3x 3.03X 1.3x 1.23% 2.2. 2.3 19 20 50% 50% 8.1 x 8.23x 5.5% 4.53% Industry 4.2% 6.4% 13.7% 40% 7.3x 50 days 8.3x 3.5x 1.5x Profit margin... Return on assets Return on equity ..... Gross margin Receivables turnover Average collection period Inventory turnover Capital asset turnover Total asset turnover Current ratio Quick ratio Debt to total assets.. Times interest earned Fixed charge coverage 45 days 8.3x 2.7x 1.1x 2.3 2.0 50% 2.1 1.7 SEE 54% 7.2x 8.1x 4.0x 5.1.X rodina Identify 3 ratios and explain what could be causing it to be lower or higher than the industry average
Step by Step Solution
There are 3 Steps involved in it
Step: 1

Get Instant Access to Expert-Tailored Solutions
See step-by-step solutions with expert insights and AI powered tools for academic success
Step: 2

Step: 3

Ace Your Homework with AI
Get the answers you need in no time with our AI-driven, step-by-step assistance
Get Started


