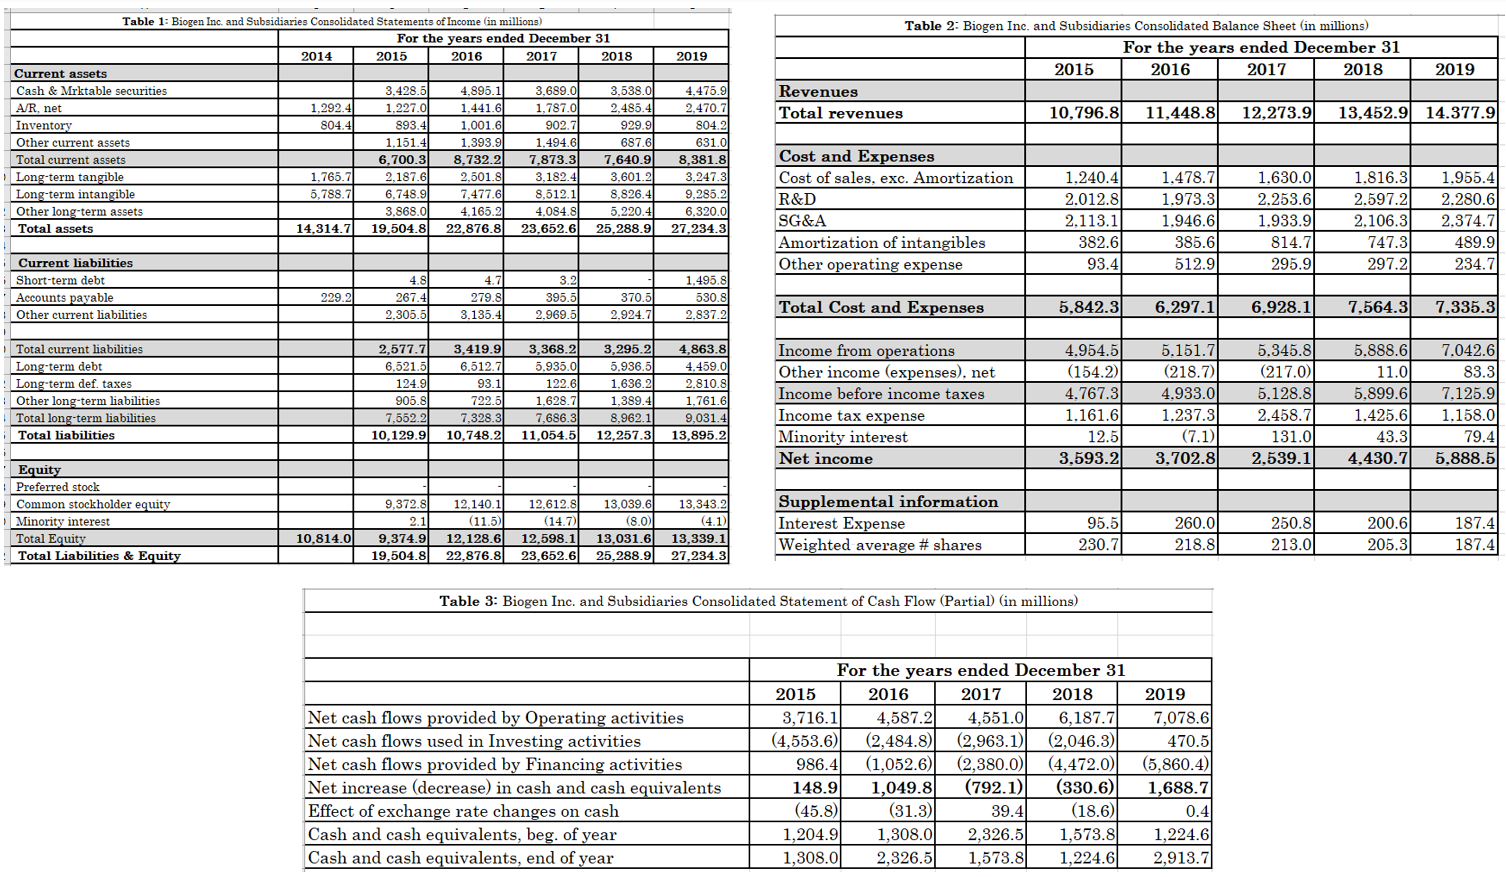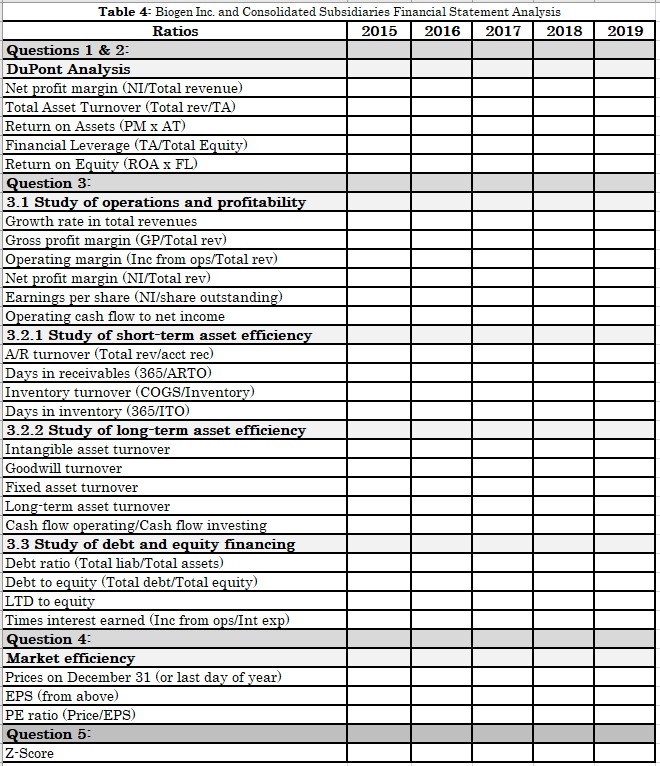

2015 2016 2018 2019 Table 2: Biogen Inc. and Subsidiaries Consolidated Balance Sheet (in millions) For the years ended December 31 2015 2016 2017 2018 2019 Revenues Total revenues 10,796.8 11,448.8 12,273.90 13,452.9 14.377.9 Table 1: Biogen Inc. and Subsidiaries Consolidated Statements of Income (in millions) For the years ended December 31 2014 2017 Current assets Cash & Mrktable securities 3,428. 4.895. 3.689.0 3,538.0 A/R, net 1.292.4 1.227.0 1.441. 1,787.0 2.485.4 Inventory 804.4 893.4 1,001.6 902.7 929.9 Other current assets 1.151.4) 1.393.9 1.494.6 687.6 Total current assets 6.700.31 8.732.2) 7,873.3 7.640.91 Long-term tangible 1.765.7 2,187.6 2,501.8 3,182.41 3,601.21 Long-term intangible 5,788.7 6,748.9 7,477.6 8,512.1 8,826.4 Other long-term assets 3.868.0 4.165.2 4.084.81 5.220.4 Total assets 14,314.7 19.504.8 22,876.8 23.652.6 25.288.9 4.475.9 2,470.7 804.2 631.0 8,381.8 3,247.3 9,285.2 6,320. 27,234.3 Cost and Expenses Cost of sales, exc. Amortization R&D SG&A Amortization of intangibles Other operating expense 1.240.41 2.012.8 2.113.1 382.6 93.4 1.478.7 1.973.3 1.946.6 385.6 512.9 1.630.0 2.253.6 1.933.9 814.7 1.816.3 2.597.2 2.106.3 747.3 297.2 1.955.4 2.280.6 2.374.7 489.9 234.7 295.9 Current liabilities Short-term debt Accounts payable Other current liabilities 4.8 267.4 2.305.5 229.2 4.7 279.8 3.135.4 3.2 395. 2.969.5 1.495.8 530.8 370.5 2.924.7 Total Cost and Expenses 6.297.1 5.842.31 6.928.1 7.564.3 7.335.3 2.837.2 Total current liabilities Long-term debt Long-term def. taxes Other long-term liabilities Total long-term liabilities Total liabilities 2,577.7 6.521.5 124.9 905.8 7,552.2 10,129.9 3,419.9 6.512.7 93.1 722.5 7,328.3 10,748.2 3,368.2 5.935.0 122.6 1.628. 7,686.3 11,054.5 3,295.2 5.936.5 1.636.2 1,389.4 8,962.1 12,257.31 4,863.8 4.459.0 2.810.8 1.761.6 9.031.4 Income from operations Other income (expenses), net Income before income taxes Income tax expense Minority interest Net income 4.954.5 (154.2) 4.767.3 1.161.61 12.5 3,593.2 5.151.7 (218.7) 4.933.0 1.237.3 (7.1) 3.702.8) 5.345.8 (217.0) 5.128.8 2.458.7 131.0 2,539.1 5.888.6 11.0 5.899.6 1.425.6 43.3 4,430.7 7.042.6 83.3 7.125.9 1.158.0 79.4 5.888.5 13,895.2 Equity Preferred stock Common stockholder equity Minority interest Total Equity Total Liabilities & Equity 9,372.8 2.1 9.374.90 19,504.8 12,140. (11.5) 12.128.6 22,876.8 12,612.8 (14.7) 12.598.1 23,652.6 13.039.6 (8.0) 13.031.6 25,288.91 13,343 2 (4.1) 13,339.1 27,234.3 Supplemental information Interest Expense Weighted average # shares 10,814.01 95.5 230.7 260.0 218.8 250.8 213.0 200.6 205.3 187.4 187.4 Table 3: Biogen Inc. and Subsidiaries Consolidated Statement of Cash Flow (Partial) (in millions) Net cash flows provided by Operating activities Net cash flows used in Investing activities Net cash flows provided by Financing activities Net increase (decrease) in cash and cash equivalents Effect of exchange rate changes on cash Cash and cash equivalents, beg. of year Cash and cash equivalents, end of year For the years ended December 31 2015 2016 2017 2018 3,716.1 4,587.2 4,551.0 6,187.7 (4,553.6) (2,484.8)| (2,963.1) (2,046.3) 986.4 (1,052.6) (2,380.0) (4,472.0) 148.9 1,049.8 (792.1) (330.6) (45.8) (31.3) 39.4 (18.6) 1,204.9 1,308.0 2,326.5 1,573.8 1,308.00 2,326.5 1,573.81 1,224.6 2019 7,078.6 470.5 (5,860.4) 1,688.7 0.4 1,224.6 2,913.7 2019 Table 4: Biogen Inc. and Consolidated Subsidiaries Financial Statement Analysis Ratios 2015 2016 2017 2018 Questions 1 & 2 DuPont Analysis Net profit margin (NI/Total revenue) Total Asset Turnover (Total rev/TA) Return on Assets (PM X AT) Financial Leverage (TA/Total Equity) Return on Equity (ROA X FL) Question 3: 3.1 Study of operations and profitability Growth rate in total revenues Gross profit margin (GP/Total rev) Operating margin (Inc from ops/Total rev) Net profit margin (NI/Total rev) Earnings per share (NI/share outstanding) Operating cash flow to net income 3.2.1 Study of short-term asset efficiency A/R turnover (Total rev/acct rec) Days in receivables (365/ARTO) Inventory turnover (COGS/Inventory) Days in inventory (365/ITO) 3.2.2 Study of long-term asset efficiency Intangible asset turnover Goodwill turnover Fixed asset turnover Long-term asset turnover Cash flow operating/Cash flow investing 3.3 Study of debt and equity financing Debt ratio (Total liab/Total assets) Debt to equity (Total debt/Total equity) LTD to equity Times interest earned (Inc from ops/Int exp) Question 4: Market efficiency Prices on December 31 (or last day of year) EPS (from above) PE ratio (Price/EPS) Question 5: Z-Score


