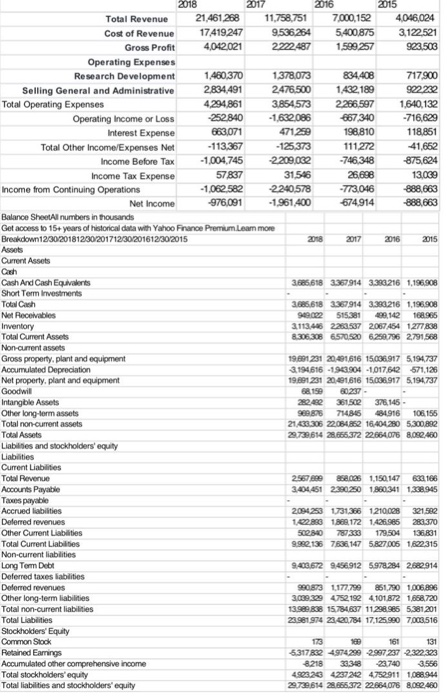
2015 4046,024 3.122521 903.503 2018 2017 2016 Total Revenue 21.461 268 11.758,751 7000,152 Cost of Revenue 17419 247 9.536.264 5.400,875 Gross Profit 4,042021 2022 487 1,599257 Operating Expenses Research Development 1480.370 1480.370 1378.073 834.408 Selling General and Administrative 2834.491 2475.500 1.432.189 Total Operating Expenses 4294 861 3.854573 2266.597 Operating Income or Loss 252840 -1532086 667340 Interest Expense 663,071 471299 198.810 Total Other Income Expenses Net -113,367 -125,373 111272 Income Before Tax -1,004,745 -2209.002 -746.348 Income Tax Expense 57837 31,546 26.688 Income from Continuing Operations -1.062.582 2240,578 -773.046 Net Income 976,091 -1.961 400 674.914 Balance Sheetal numbers in thousands Get access to 15+ years of historical data with Yahoo Finance Premium Leam more Breakdown 12/30/201812/30/201712/30/201612/30/2015 2018 2017 Assets Current Assets 717.900 92222 1840,132 -716,629 118.851 875,624 13.030 888.663 888.663 2016 2015 ch 3.585.618 3367914 3.383.216 1196.08 3.686618 3367914 3.300.216 1,196.908 949022515.381 40,142 168.965 3113.406 22037 2067444 1277 8.306 308 6.570.520 6.259.796 2.791.568 1991 231 20001 616 1 917 191737 3.194616 19.3041017012671.126 19891231 20001 616 15917 5194737 68199 0247 28.62 361502376.145 960.875 714815 1916 106156 21,433,306 22064852 16.404280 5.300.000 23.730654 28.866.372 22.864.076 8.082,460 Cash And Cash Equivalent Short Term Investments Total Cash Not Receivables Inventory Total Current Assets Non-current assets Gross property, plant and equipment Accumulated Depreciation Net property, plant and equipment Goodwil Intangble Assets Other long form assets Total non-current assets Total Assets Liabilities and stockholders' equity Labtes Current Liabilities Towevenue Accounts Payable Taxes payable Accrued abilities Deferred revenues Other Current Liabilities Total Current Liabilities Noncurrent abilities Long Term Debt Deferred taxes abies Deferred revenues Other long-term labies Total non-current abilities Totalbes Stockholders' Equity Common Stock Read Eags Accumulated other comprehensive income Total stockholders' equity Total abilities and stockholders' equity 2557699 01101010 340405122 1 341 138.945 2004253 473166 1210009301 SRO TOP 1 72 TENGAS 502802 17350435831 9.982 136 7636 17 5.827005 1522315 9:43,672 9466912 5.973.284 2802914 903 1720 120 100 3.039 309 4752 19 4101872 1868.720 13.986.38 15784537 11298.965 5381201 23.96194 2320784 17.125.900 7003.516 631784974299 2997 237 232323 8.218 3236 4923. 23 42372472911 1 946 29736614 2666372 22.864.675 8.06.480 1. What is ratio of net sales to assets for 2018, 2017 and 2016 using this formula: Ratio of Net Sales to Assets = Net Sales/Average Total Assets 2. Based on your results above is the ratio of net sales to assets getting better or worse? 3. What is the inventory turnover for the period 2018, 2017 and 2017 using this formula: Inventory Turnover = Cost of goods sold Average Inventory 4. Based on the answers to questions 3 is inventory turnover getting better or worse? 5. What is the number of days' sales in inventory for 2016, 2017 and 2018 based on this formula: Number of days' sales in inventory = 365/turnover 6. It is worse for Number of days' sales in inventory to go down over time (True or False)? 7. What is the Accounts Receivable Turnover for 2017 and 2018? 2015 4046,024 3.122521 903.503 2018 2017 2016 Total Revenue 21.461 268 11.758,751 7000,152 Cost of Revenue 17419 247 9.536.264 5.400,875 Gross Profit 4,042021 2022 487 1,599257 Operating Expenses Research Development 1480.370 1480.370 1378.073 834.408 Selling General and Administrative 2834.491 2475.500 1.432.189 Total Operating Expenses 4294 861 3.854573 2266.597 Operating Income or Loss 252840 -1532086 667340 Interest Expense 663,071 471299 198.810 Total Other Income Expenses Net -113,367 -125,373 111272 Income Before Tax -1,004,745 -2209.002 -746.348 Income Tax Expense 57837 31,546 26.688 Income from Continuing Operations -1.062.582 2240,578 -773.046 Net Income 976,091 -1.961 400 674.914 Balance Sheetal numbers in thousands Get access to 15+ years of historical data with Yahoo Finance Premium Leam more Breakdown 12/30/201812/30/201712/30/201612/30/2015 2018 2017 Assets Current Assets 717.900 92222 1840,132 -716,629 118.851 875,624 13.030 888.663 888.663 2016 2015 ch 3.585.618 3367914 3.383.216 1196.08 3.686618 3367914 3.300.216 1,196.908 949022515.381 40,142 168.965 3113.406 22037 2067444 1277 8.306 308 6.570.520 6.259.796 2.791.568 1991 231 20001 616 1 917 191737 3.194616 19.3041017012671.126 19891231 20001 616 15917 5194737 68199 0247 28.62 361502376.145 960.875 714815 1916 106156 21,433,306 22064852 16.404280 5.300.000 23.730654 28.866.372 22.864.076 8.082,460 Cash And Cash Equivalent Short Term Investments Total Cash Not Receivables Inventory Total Current Assets Non-current assets Gross property, plant and equipment Accumulated Depreciation Net property, plant and equipment Goodwil Intangble Assets Other long form assets Total non-current assets Total Assets Liabilities and stockholders' equity Labtes Current Liabilities Towevenue Accounts Payable Taxes payable Accrued abilities Deferred revenues Other Current Liabilities Total Current Liabilities Noncurrent abilities Long Term Debt Deferred taxes abies Deferred revenues Other long-term labies Total non-current abilities Totalbes Stockholders' Equity Common Stock Read Eags Accumulated other comprehensive income Total stockholders' equity Total abilities and stockholders' equity 2557699 01101010 340405122 1 341 138.945 2004253 473166 1210009301 SRO TOP 1 72 TENGAS 502802 17350435831 9.982 136 7636 17 5.827005 1522315 9:43,672 9466912 5.973.284 2802914 903 1720 120 100 3.039 309 4752 19 4101872 1868.720 13.986.38 15784537 11298.965 5381201 23.96194 2320784 17.125.900 7003.516 631784974299 2997 237 232323 8.218 3236 4923. 23 42372472911 1 946 29736614 2666372 22.864.675 8.06.480 1. What is ratio of net sales to assets for 2018, 2017 and 2016 using this formula: Ratio of Net Sales to Assets = Net Sales/Average Total Assets 2. Based on your results above is the ratio of net sales to assets getting better or worse? 3. What is the inventory turnover for the period 2018, 2017 and 2017 using this formula: Inventory Turnover = Cost of goods sold Average Inventory 4. Based on the answers to questions 3 is inventory turnover getting better or worse? 5. What is the number of days' sales in inventory for 2016, 2017 and 2018 based on this formula: Number of days' sales in inventory = 365/turnover 6. It is worse for Number of days' sales in inventory to go down over time (True or False)? 7. What is the Accounts Receivable Turnover for 2017 and 2018