

Answered step by step
Verified Expert Solution
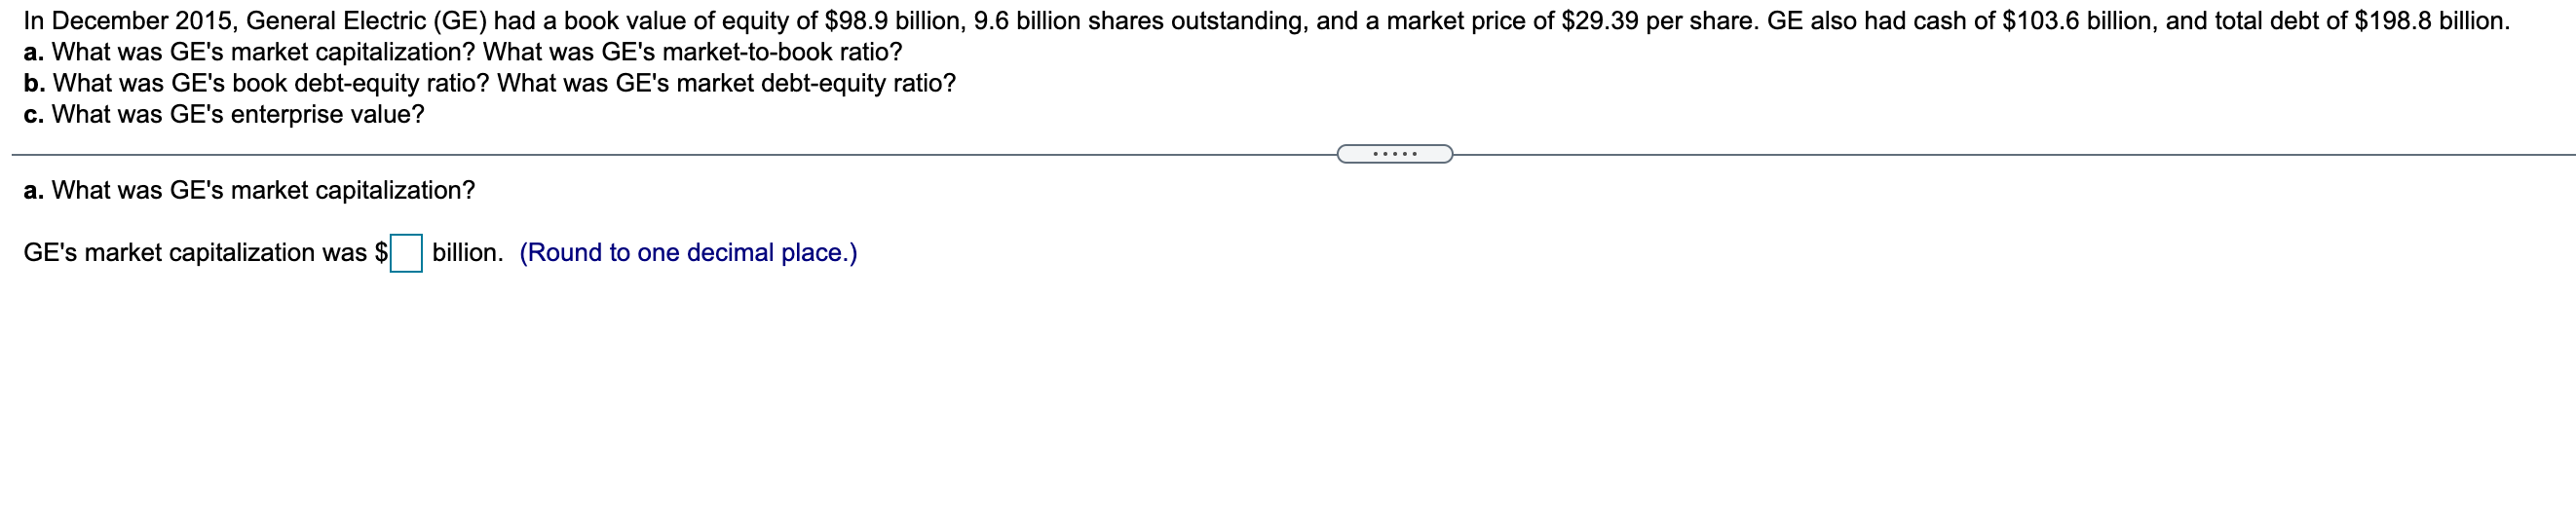
Question
1 Approved Answer
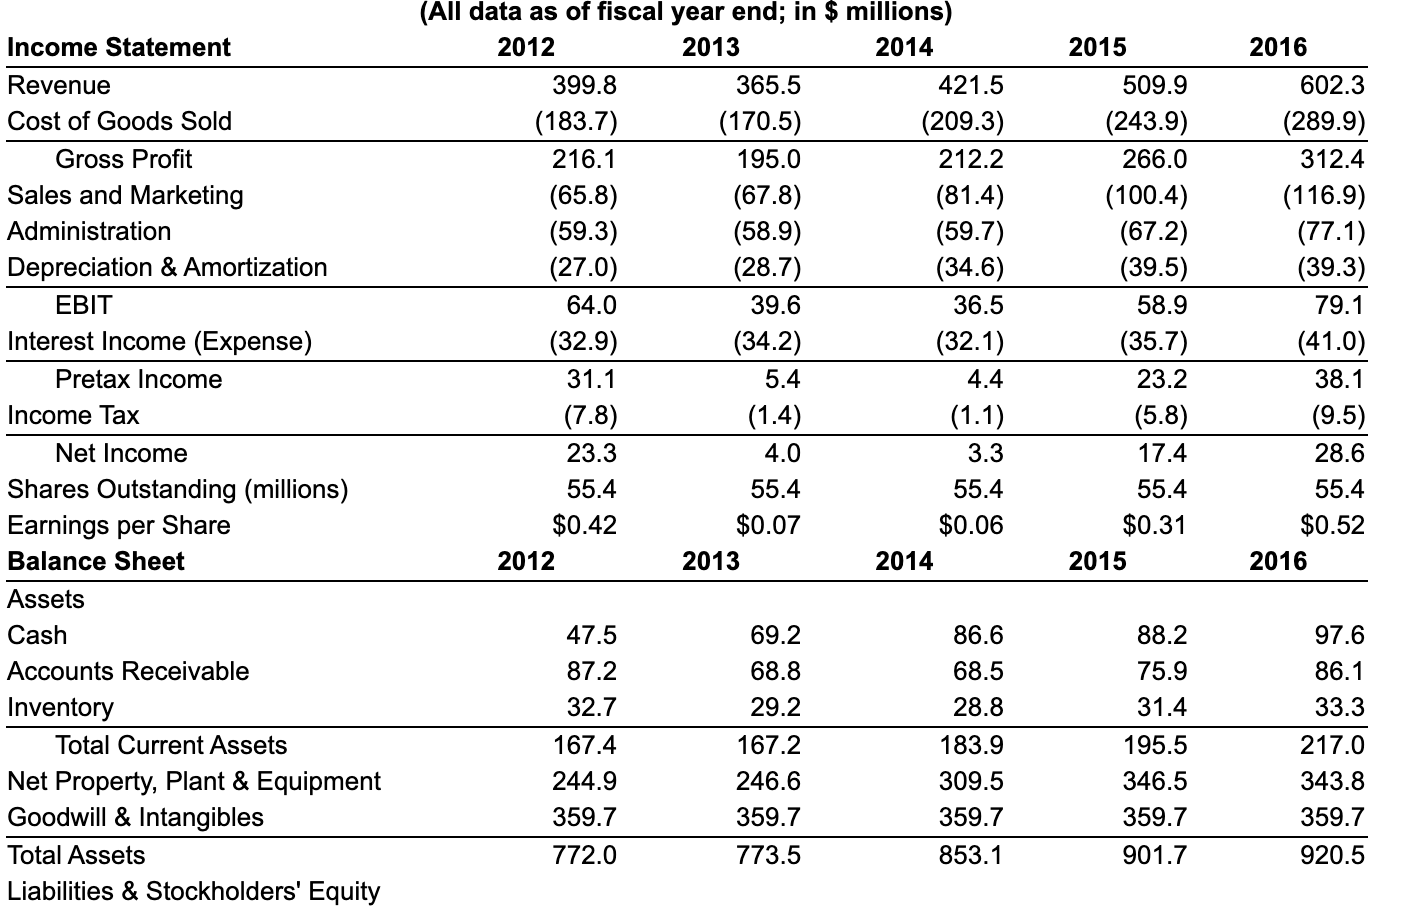
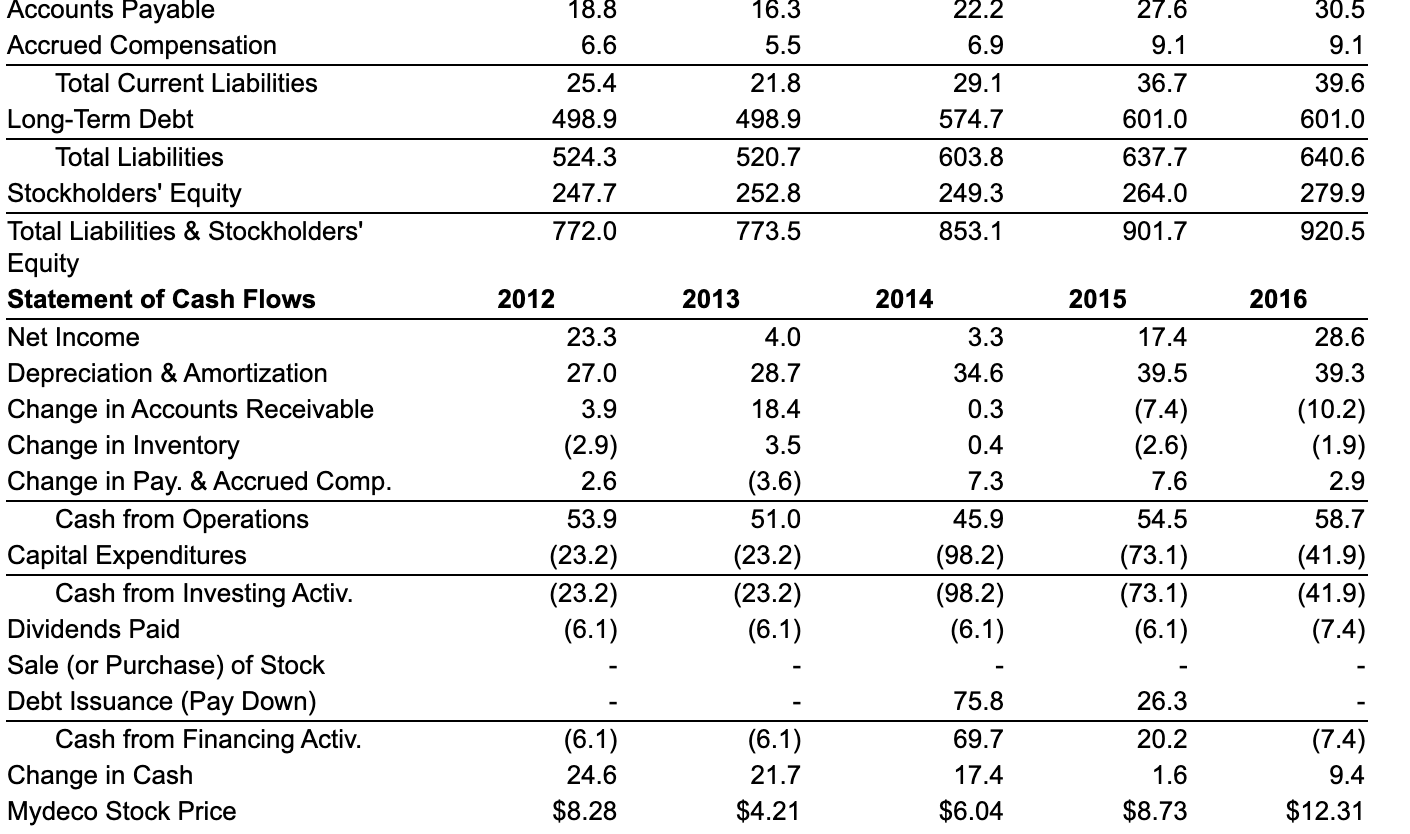
2015 Income Statement Revenue Cost of Goods Sold Gross Profit Sales and Marketing Administration Depreciation & Amortization EBIT Interest Income (Expense) Pretax Income Income Tax
Step by Step Solution
There are 3 Steps involved in it
Step: 1

Get Instant Access to Expert-Tailored Solutions
See step-by-step solutions with expert insights and AI powered tools for academic success
Step: 2

Step: 3
Ace Your Homework with AI
Get the answers you need in no time with our AI-driven, step-by-step assistance
Get Started
Personal Financial Planning For Executives And Entrepreneurs
Authors: Michael J. Nathanson, Jeffrey T. Craig, Jennifer A. Geoghegan, Nadine Gordon Lee, Michael A. Haber, Seth P. Hieken, Matthew C. Ilteris, D. Scott McDonald, Joseph A. Salvati, Stephen R. Stelljes
1st Edition
3030405273, 978-3030405274