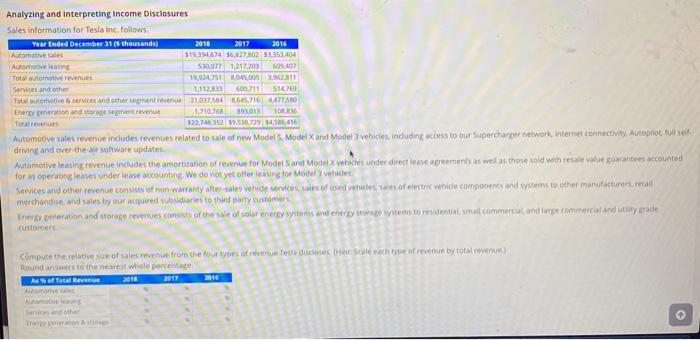
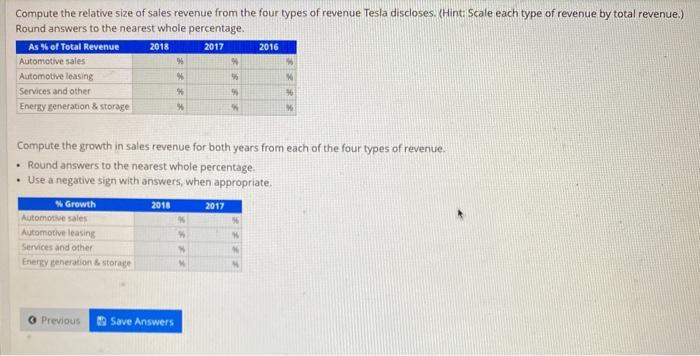
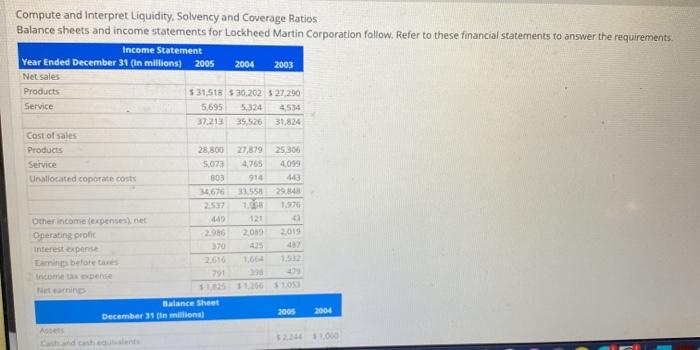
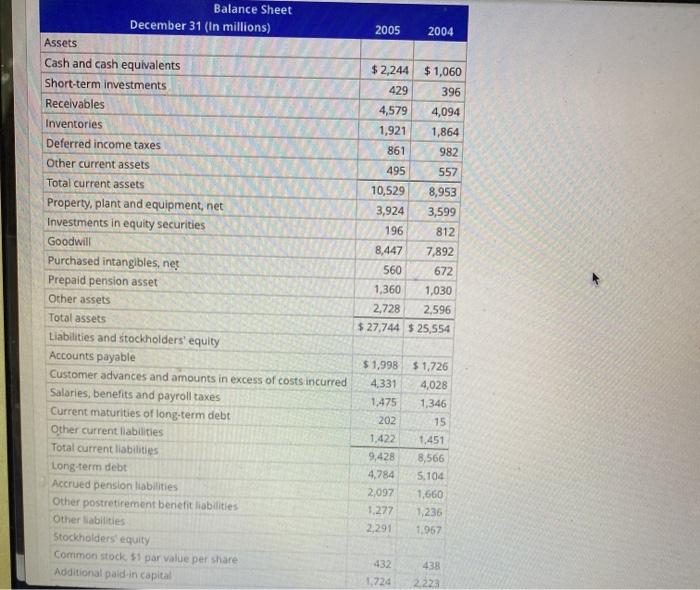
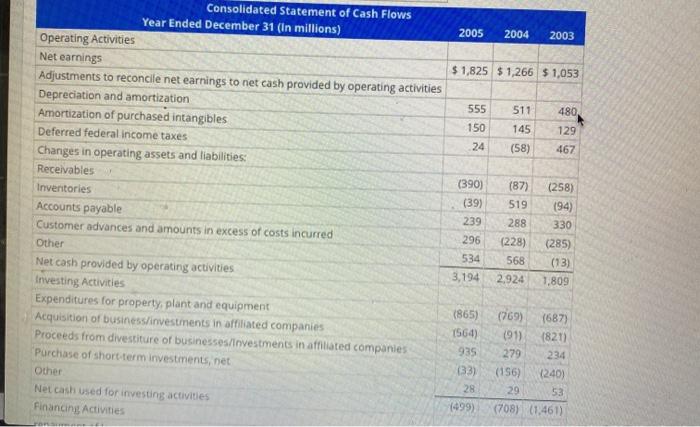
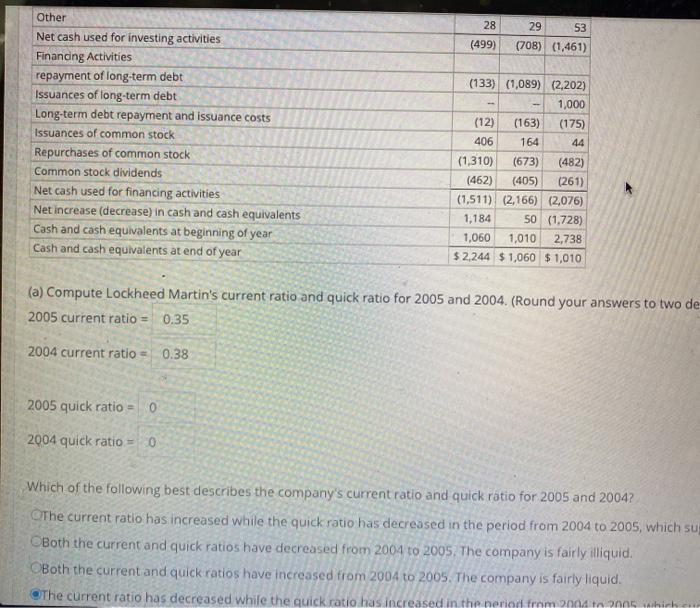
2016 Analyzing and interpreting Income Disclosures Sales information for Tesla inc. follows: Year Ended December 31sthousands 2018 2017 Automotive Sales $1939.674 56,427,802 53351 404 Admin 530077 1.212.2013 407 Total automotive revenues 19.9A7511045.005.02.11 Services and other 1.112.33 600711 5140 Total automotive services and other ment revie210173841645.2300472510 Enerreracion and store mentreven 1.710760 89301 3227452 959 416 Automotive sales revenue includes revenues related to sale of new Model 5. Model X and Model vehicles, including actess to our Supercharger network internet connectivity. Autopilot el driving and over the software update Automotive Instrevenue includes the amortication of revenue for Models and Model vehicles under direct least agreements as wel as those cold with severantees accounted for as operating lases under lease accounting. We do not yet offer leasing for Modelvides Services and other revenue cons of non warranty after sales wide vales of used vehicles are of electric vehicle components and systems to other manufacturers, retail merchandise and sales by our acquired subsidiaries to third party customer Energy Beneration and store revenues cons of the sale of solar enery systems and here some se to desiatismal commercial and large commerce and trade tomers Compute the relatives of sales revenue from the four types of revenue leurs discoses Scaleach type of revenue by total revenue Round answers to the nearest whole percentage As of Total Revenue 2018 2016 2017 Seniors and other 2017 Compute the relative size of sales revenue from the four types of revenue Tesla discoses (Hint Scale each type of revenue by total revenue.) Round answers to the nearest whole percentage. As of Total Revenue 2018 2016 Automotive sales % Automotive leasing Services and other * Energy generation & storage M Compute the growth in sales revenue for both years from each of the four types of revenue. Round answers to the nearest whole percentage Use a negative sign with answers, when appropriate. Growth 2018 2017 Automotive Sales Automotive leasing Services and other Energy generation & storale Previous Save Answers Compute and interpret Liquidity, Solvency and Coverage Ratios Balance sheets and income statements for Lockheed Martin Corporation follow. Refer to these financial statements to answer the requirements. Income Statement Year Ended December 31 (In millions) 2005 2004 2003 Net sales Products $ 31,518 5 30.262 $27,290 Service 5.695 4534 37.213 35 526 31,824 Cast of sales Products 28.800 27,679 25.306 Service 5.073 4.765 4,099 Unallocated coporate costs BOS 914 443 676 29.4 1.976 Other income expenses et 440 121 2009 2010 Operating profit interest expense 30 1,664 1.53 income tax bente $11110610 Balance Sheet December 3 miliona 2005 2004 As 2005 2004 Balance Sheet December 31 (in millions) Assets Cash and cash equivalents Short-term investments Receivables Inventories Deferred income taxes Other current assets Total current assets Property, plant and equipment, net Investments in equity securities Goodwill Purchased intangibles, nes Prepaid pension asset Other assets Total assets Liabilities and stockholders' equity Accounts payable Customer advances and amounts in excess of costs incurred Salaries, benefits and payroll taxes Current maturities of long-term debt Other current liabilities Total current liabilities Long-term debt Accrued pension liabilities Other postretirement benefit liabilities Other liabilities Stockholders' equity Common stock 51 par value per share Additional paid in capital $2,244 $ 1,060 429 396 4,579 4,094 1,921 1,864 861 982 495 557 10,529 8,953 3,924 3,599 196 812 8,447 7,892 560 672 1,360 1,030 2,728 2,596 $ 27,744 $25,554 $ 1,998 4,331 1,475 202 1,422 9,428 4,784 2,097 1,277 2,291 $1,726 4,028 1,346 15 1,451 8,566 5.104 1,660 1,236 1.957 432 1.724 438 2.223 2005 2004 2003 $ 1,825 $1,266 $1,053 511 480 555 150 24 145 129 (58) 467 Consolidated Statement of Cash Flows Year Ended December 31 (In millions) Operating Activities Net earnings Adjustments to reconcile net earnings to net cash provided by operating activities Depreciation and amortization Amortization of purchased intangibles Deferred federal income taxes Changes in operating assets and liabilities: Receivables Inventories Accounts payable Customer advances and amounts in excess of costs incurred Other Net cash provided by operating activities Investing Activities Expenditures for property, plant and equipment Acquisition of business/investments in affiliated companies Proceeds from divestiture of businesses investments in affiliated companies Purchase of short-term investments, net Other Net cash used for investing activities Financing Activities (390) (39) 239 (87) 519 288 (228) 568 2.924 296 534 3,194 (258) (94) 330 (285) (13) 1,809 (865) 1564) 935 (33) 1769) (687) (91) (821) 279 234 (156) (240) 29 53 (708) (1.461) 28 (499) 53 28 (499) 29 (708) (1,461) Other Net cash used for investing activities Financing Activities repayment of long-term debt Issuances of long-term debt Long-term debt repayment and issuance costs Issuances of common stock Repurchases of common stock Common stock dividends Net cash used for financing activities Net increase (decrease) in cash and cash equivalents Cash and cash equivalents at beginning of year Cash and cash equivalents at end of year (133) (1,089) (2,202) 1,000 (12) (163) (175) 406 164 44 (1,310) (673) (482) (462) (405) (261) (1,511) (2,166) (2,076) 1,184 50 (1,728) 1,060 1,010 2,738 $2,244 $1,060 $ 1,010 (a) Compute Lockheed Martin's current ratio and quick ratio for 2005 and 2004. (Round your answers to two de 2005 current ratio = 0.35 2004 current ratio 0.38 2005 quick ratio = 0 2004 quick ratio = 0 Which of the following best describes the company's current ratio and quick ratio for 2005 and 2004? The current ratio has increased while the quick ratio has decreased in the period from 2004 to 2005, which su Both the current and quick ratios have decreased from 2004 to 2005. The company is fairly illiquid. Both the current and quick ratios have increased from 2004 to 2005. The company is fairly liquid. The current ratio has decreased while the quick ratio has increased in the neriod from 2004 2005 which 2016 Analyzing and interpreting Income Disclosures Sales information for Tesla inc. follows: Year Ended December 31sthousands 2018 2017 Automotive Sales $1939.674 56,427,802 53351 404 Admin 530077 1.212.2013 407 Total automotive revenues 19.9A7511045.005.02.11 Services and other 1.112.33 600711 5140 Total automotive services and other ment revie210173841645.2300472510 Enerreracion and store mentreven 1.710760 89301 3227452 959 416 Automotive sales revenue includes revenues related to sale of new Model 5. Model X and Model vehicles, including actess to our Supercharger network internet connectivity. Autopilot el driving and over the software update Automotive Instrevenue includes the amortication of revenue for Models and Model vehicles under direct least agreements as wel as those cold with severantees accounted for as operating lases under lease accounting. We do not yet offer leasing for Modelvides Services and other revenue cons of non warranty after sales wide vales of used vehicles are of electric vehicle components and systems to other manufacturers, retail merchandise and sales by our acquired subsidiaries to third party customer Energy Beneration and store revenues cons of the sale of solar enery systems and here some se to desiatismal commercial and large commerce and trade tomers Compute the relatives of sales revenue from the four types of revenue leurs discoses Scaleach type of revenue by total revenue Round answers to the nearest whole percentage As of Total Revenue 2018 2016 2017 Seniors and other 2017 Compute the relative size of sales revenue from the four types of revenue Tesla discoses (Hint Scale each type of revenue by total revenue.) Round answers to the nearest whole percentage. As of Total Revenue 2018 2016 Automotive sales % Automotive leasing Services and other * Energy generation & storage M Compute the growth in sales revenue for both years from each of the four types of revenue. Round answers to the nearest whole percentage Use a negative sign with answers, when appropriate. Growth 2018 2017 Automotive Sales Automotive leasing Services and other Energy generation & storale Previous Save Answers Compute and interpret Liquidity, Solvency and Coverage Ratios Balance sheets and income statements for Lockheed Martin Corporation follow. Refer to these financial statements to answer the requirements. Income Statement Year Ended December 31 (In millions) 2005 2004 2003 Net sales Products $ 31,518 5 30.262 $27,290 Service 5.695 4534 37.213 35 526 31,824 Cast of sales Products 28.800 27,679 25.306 Service 5.073 4.765 4,099 Unallocated coporate costs BOS 914 443 676 29.4 1.976 Other income expenses et 440 121 2009 2010 Operating profit interest expense 30 1,664 1.53 income tax bente $11110610 Balance Sheet December 3 miliona 2005 2004 As 2005 2004 Balance Sheet December 31 (in millions) Assets Cash and cash equivalents Short-term investments Receivables Inventories Deferred income taxes Other current assets Total current assets Property, plant and equipment, net Investments in equity securities Goodwill Purchased intangibles, nes Prepaid pension asset Other assets Total assets Liabilities and stockholders' equity Accounts payable Customer advances and amounts in excess of costs incurred Salaries, benefits and payroll taxes Current maturities of long-term debt Other current liabilities Total current liabilities Long-term debt Accrued pension liabilities Other postretirement benefit liabilities Other liabilities Stockholders' equity Common stock 51 par value per share Additional paid in capital $2,244 $ 1,060 429 396 4,579 4,094 1,921 1,864 861 982 495 557 10,529 8,953 3,924 3,599 196 812 8,447 7,892 560 672 1,360 1,030 2,728 2,596 $ 27,744 $25,554 $ 1,998 4,331 1,475 202 1,422 9,428 4,784 2,097 1,277 2,291 $1,726 4,028 1,346 15 1,451 8,566 5.104 1,660 1,236 1.957 432 1.724 438 2.223 2005 2004 2003 $ 1,825 $1,266 $1,053 511 480 555 150 24 145 129 (58) 467 Consolidated Statement of Cash Flows Year Ended December 31 (In millions) Operating Activities Net earnings Adjustments to reconcile net earnings to net cash provided by operating activities Depreciation and amortization Amortization of purchased intangibles Deferred federal income taxes Changes in operating assets and liabilities: Receivables Inventories Accounts payable Customer advances and amounts in excess of costs incurred Other Net cash provided by operating activities Investing Activities Expenditures for property, plant and equipment Acquisition of business/investments in affiliated companies Proceeds from divestiture of businesses investments in affiliated companies Purchase of short-term investments, net Other Net cash used for investing activities Financing Activities (390) (39) 239 (87) 519 288 (228) 568 2.924 296 534 3,194 (258) (94) 330 (285) (13) 1,809 (865) 1564) 935 (33) 1769) (687) (91) (821) 279 234 (156) (240) 29 53 (708) (1.461) 28 (499) 53 28 (499) 29 (708) (1,461) Other Net cash used for investing activities Financing Activities repayment of long-term debt Issuances of long-term debt Long-term debt repayment and issuance costs Issuances of common stock Repurchases of common stock Common stock dividends Net cash used for financing activities Net increase (decrease) in cash and cash equivalents Cash and cash equivalents at beginning of year Cash and cash equivalents at end of year (133) (1,089) (2,202) 1,000 (12) (163) (175) 406 164 44 (1,310) (673) (482) (462) (405) (261) (1,511) (2,166) (2,076) 1,184 50 (1,728) 1,060 1,010 2,738 $2,244 $1,060 $ 1,010 (a) Compute Lockheed Martin's current ratio and quick ratio for 2005 and 2004. (Round your answers to two de 2005 current ratio = 0.35 2004 current ratio 0.38 2005 quick ratio = 0 2004 quick ratio = 0 Which of the following best describes the company's current ratio and quick ratio for 2005 and 2004? The current ratio has increased while the quick ratio has decreased in the period from 2004 to 2005, which su Both the current and quick ratios have decreased from 2004 to 2005. The company is fairly illiquid. Both the current and quick ratios have increased from 2004 to 2005. The company is fairly liquid. The current ratio has decreased while the quick ratio has increased in the neriod from 2004 2005 which
