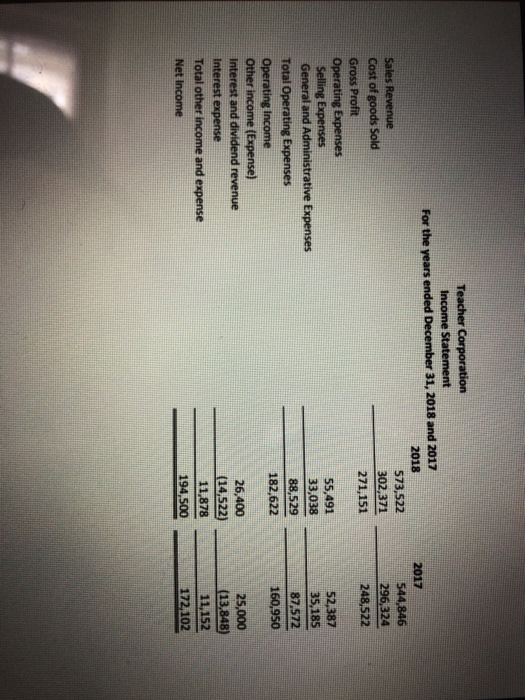
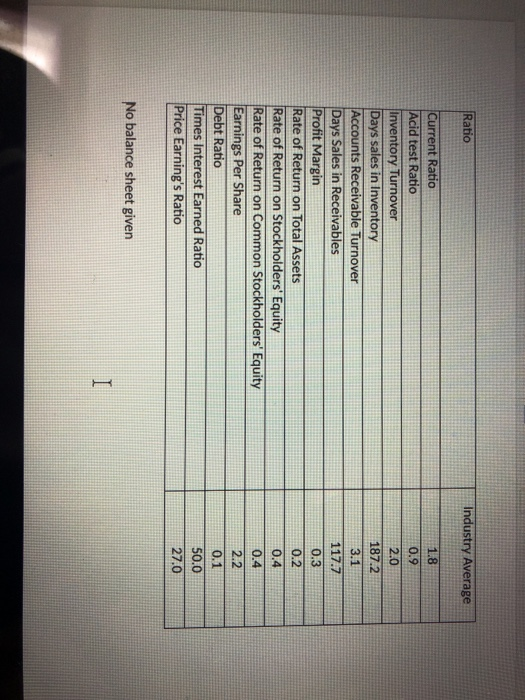
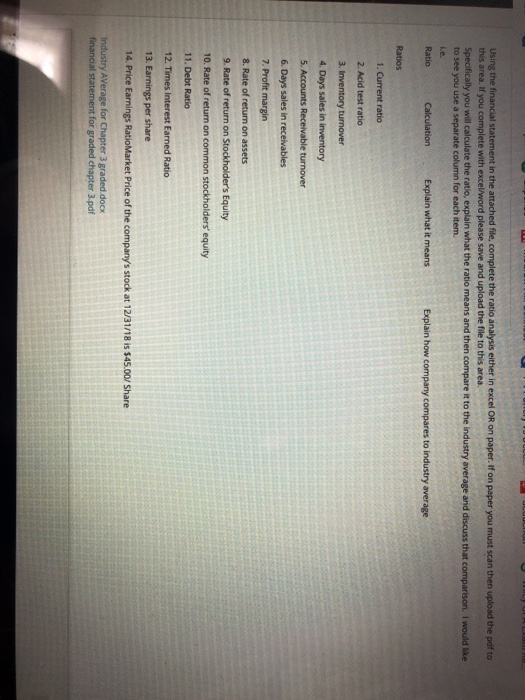
2017 544,846 296,324 248,522 Teacher Corporation Income Statement For the years ended December 31, 2018 and 2017 2018 573,522 Sales Revenue Cost of goods Sold 302,371 Gross Profit 271,151 Operating Expenses Selling Expenses 55,491 General and Administrative Expenses 33,038 Total Operating Expenses 88,529 Operating Income 182,622 Other income (Expense) Interest and dividend revenue 26,400 Interest expense (14,522) Total other income and expense 11,878 Net Income 194,500 52,387 35,185 87,572 160,950 25,000 (13,848) 11,152 172. 102 Ratio Industry Average 0.9 187.2 117.7 Current Ratio Acid test Ratio Inventory Turnover Days sales in Inventory Accounts Receivable Turnover Days Sales in Receivables Profit Margin Rate of Return on Total Assets Rate of Return on Stockholders' Equity Rate of Return on Common Stockholders' Equity Earnings Per Share Debt Ratio Times Interest Earned Ratio Price Earning's Ratio No balance sheet given Using the financial statement in the attached file, complete the ratio analysis either in excel OR on paper. If on paper you must scan then upload the pdf to this area. If you complete with excel/Word please save and upload the file to this area. Specifically you will calculate the ratio, explain what the ratio means and then compare it to the industry average and discuss that comparison. I would like to see you use a separate column for each item. Ratio Calculation Explain what it means Explain how company compares to industry average Ratios 1. Current ratio 2. Acid test ratio 3. Inventory turnover 4. Days sales in inventory 5. Accounts Receivable turnover 6. Days sales in receivables 7. Profit margin 8. Rate of return on assets 9. Rate of return on Stockholder's Equity 10. Rate of return on common stockholders' equity 11. Debt Ratio 12. Times Interest Earned Ratio 13. Earnings per share 14. Price Earnings Ratio Market Price of the company's stock at 12/31/18 is $45.00/ Share Industry Average for Chapter 3 graded.docx financial statement for graded chapter 3.pdf 2017 544,846 296,324 248,522 Teacher Corporation Income Statement For the years ended December 31, 2018 and 2017 2018 573,522 Sales Revenue Cost of goods Sold 302,371 Gross Profit 271,151 Operating Expenses Selling Expenses 55,491 General and Administrative Expenses 33,038 Total Operating Expenses 88,529 Operating Income 182,622 Other income (Expense) Interest and dividend revenue 26,400 Interest expense (14,522) Total other income and expense 11,878 Net Income 194,500 52,387 35,185 87,572 160,950 25,000 (13,848) 11,152 172. 102 Ratio Industry Average 0.9 187.2 117.7 Current Ratio Acid test Ratio Inventory Turnover Days sales in Inventory Accounts Receivable Turnover Days Sales in Receivables Profit Margin Rate of Return on Total Assets Rate of Return on Stockholders' Equity Rate of Return on Common Stockholders' Equity Earnings Per Share Debt Ratio Times Interest Earned Ratio Price Earning's Ratio No balance sheet given Using the financial statement in the attached file, complete the ratio analysis either in excel OR on paper. If on paper you must scan then upload the pdf to this area. If you complete with excel/Word please save and upload the file to this area. Specifically you will calculate the ratio, explain what the ratio means and then compare it to the industry average and discuss that comparison. I would like to see you use a separate column for each item. Ratio Calculation Explain what it means Explain how company compares to industry average Ratios 1. Current ratio 2. Acid test ratio 3. Inventory turnover 4. Days sales in inventory 5. Accounts Receivable turnover 6. Days sales in receivables 7. Profit margin 8. Rate of return on assets 9. Rate of return on Stockholder's Equity 10. Rate of return on common stockholders' equity 11. Debt Ratio 12. Times Interest Earned Ratio 13. Earnings per share 14. Price Earnings Ratio Market Price of the company's stock at 12/31/18 is $45.00/ Share Industry Average for Chapter 3 graded.docx financial statement for graded chapter 3.pdf