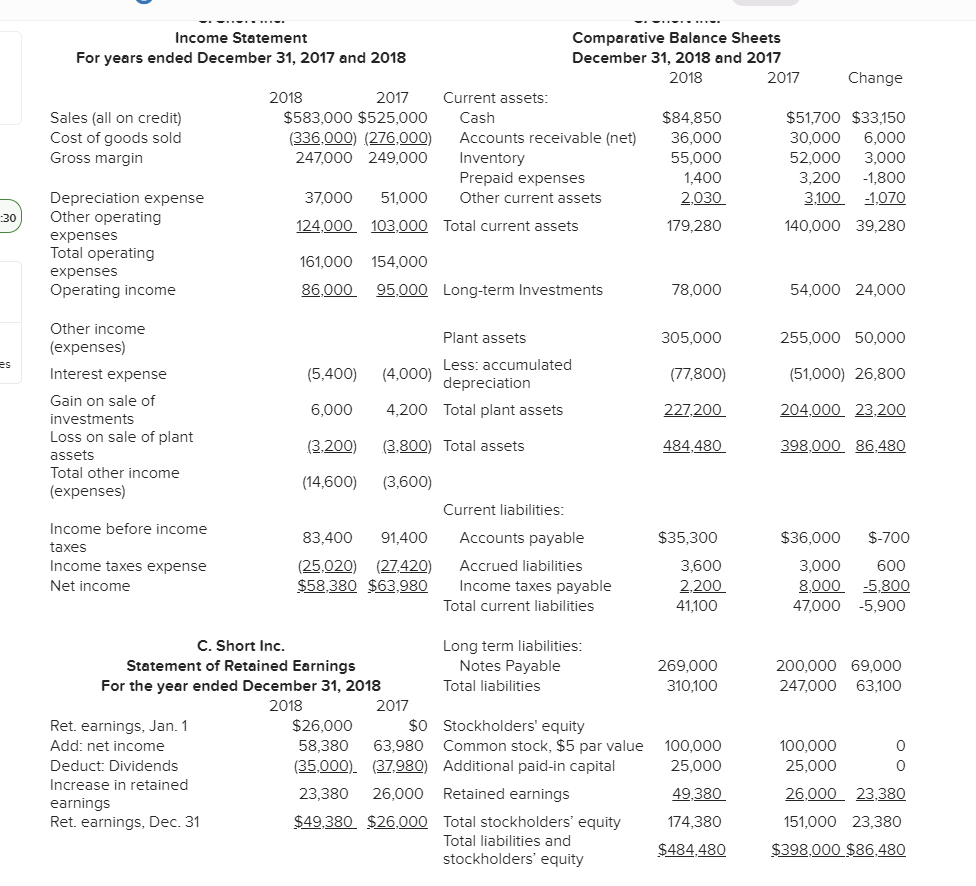

2017 Income Statement Comparative Balance Sheets For years ended December 31, 2017 and 2018 December 31, 2018 and 2017 2018 2017 Change 2018 2017 Current assets: Sales (all on credit) $583,000 $525,000 Cash $84,850 $51,700 $33,150 Cost of goods sold (336,000) (276.000) Accounts receivable (net) 36,000 30,000 6,000 Gross margin 247,000 249,000 Inventory 55,000 52,000 3,000 Prepaid expenses 1,400 3,200 -1,800 Depreciation expense 37,000 51,000 Other current assets 2030 3,100 1,070 Other operating 124,000 103,000 Total current assets 179,280 140,000 39,280 expenses Total operating 161,000 154,000 expenses Operating income 86,000 95,000 Long-term Investments 78,000 54,000 24,000 Other income (expenses) 305,000 255,000 50,000 (77,800) 227.200 Interest expense Gain on sale of investments Loss on sale of plant assets Total other income (expenses) (51,000) 26,800 204.000 23.200 398.000 86,480 484,480 Plant assets Less: accumulated (5,400) (4,000) depreciation 6,000 4,200 Total plant assets (3,200) (3.800) Total assets (14,600) (3,600) Current liabilities: 83,400 91,400 Accounts payable (25.020) (27.420) Accrued liabilities $58,380 $63,980 Income taxes payable Total current liabilities Income before income taxes Income taxes expense Net income $35,300 3,600 2,200 41,100 $36,000 3,000 8.000 47,000 $-700 600 -5.800 -5,900 269,000 310,100 200,000 69,000 247,000 63,100 C. Short Inc. Long term liabilities: Statement of Retained Earnings Notes Payable For the year ended December 31, 2018 Total liabilities 2018 2017 Ret. earnings, Jan. 1 $26,000 $0 Stockholders' equity Add: net income 58.380 63.980 Common stock, $5 par value Deduct: Dividends (35.000). (37,980) Additional paid-in capital Increase in retained 23,380 26,000 Retained earnings earnings Ret. earnings, Dec. 31 $49,380 $26.000 Total stockholders' equity Total liabilities and stockholders' equity 100,000 25,000 49,380 174,380 $484,480 100,000 0 25,0000 26.000 23.380 151,000 23,380 $398,000 $86,480 20,000 Other Information: Shares of common stock outstanding Earnings per share Dividends per share Market price per share, common stock 20,000 $2.92 $1.75 $15 $32 $12 Cash Flows from Oper Horiz Analysis Horiz Analysis Vertic Analysis Vertic Analysis Inc St Bal St Inc St Bal Sheet Ratios Choose Numerator Enter Numerator Value Enter Denominator Value Choose Denominator Ratio Current ratio Earnings per share Acid-test ratio Inventory turnover Days' sales in inventory Accounts receivable turnover receivables Total asset turnover Debt-to-equity ratio Profit margin Return on total assets Return on common stockholders' equity Price earnings ratio (PE) Dividend yield