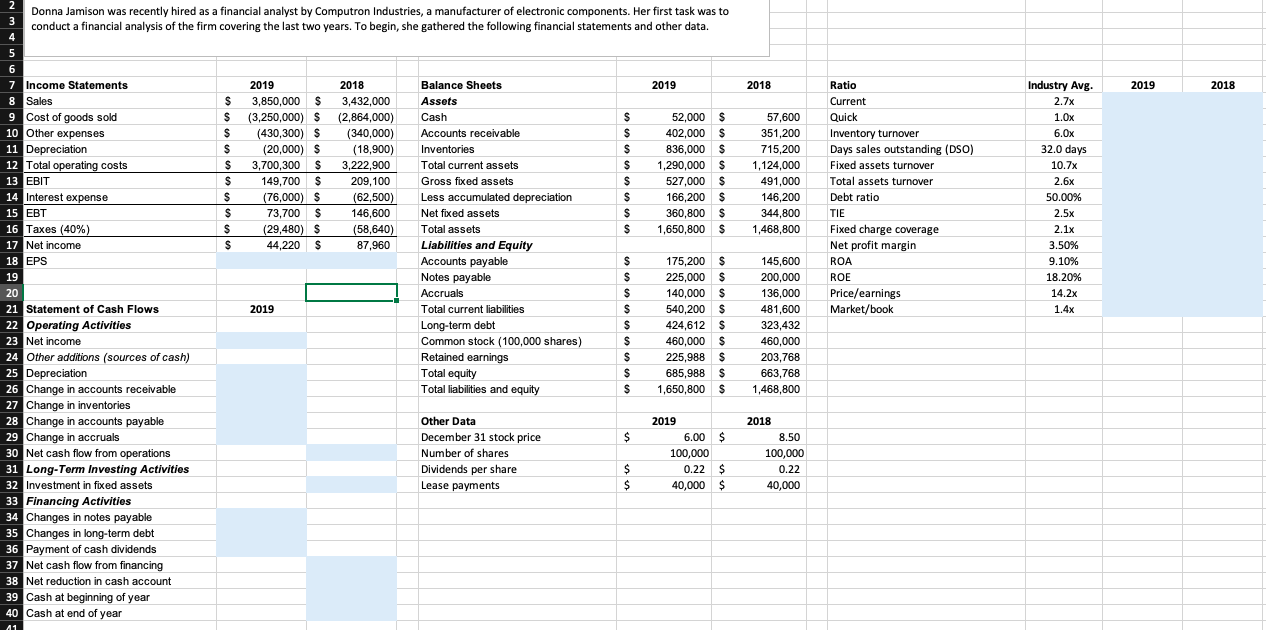
2018 2019 2018 57,600 351,200 715,200 1,124,000 491,000 146,200 344,800 1,468,800 2 Donna Jamison was recently hired as a financial analyst by Computron Industries, a manufacturer of electronic components. Her first task was to 3 conduct a financial analysis of the firm covering the last two years. To begin, she gathered the following financial statements and other data. 4 5 6 7 Income Statements 2019 2018 Balance Sheets 2019 8 Sales $ 3,850,000 $ S 3,432,000 Assets 9 Cost of goods sold S (3,250,000) $ (2,864,000) Cash $ 52,000 $ 10 Other expenses S (430,300) $ (340,000) Accounts receivable $ 402,000 $ S 11 Depreciation S (20,000) $ (18,900) w Inventories $ 836,000 $ 12 Total operating costs $ 3,700,300 $ 3,222,900 Total current assets $ 1,290,000 $ 13 EBIT $ 149,700 $ 209,100 Gross fixed assets $ 527,000 $ S des 14 Interest expense S non (76,000) $ (62,500) Less accumulated depreciation $ 166,200 S 15 EBT $ S 73,700 $ $ 146,600 Net fixed assets $ 360,800 $ 16 Taxes (40%) S (29,480) $ (58,640) Total assets $ 1,650,800 $ 17 Net income $ S 44,220 $ $ 87,960 Liabilities and Equity 18 EPS Accounts payable S 175,200 $ som 19 Notes payable S o pay 225,000 $ 20 Accruals S 140,000 $ 21 Statement of Cash Flows 2019 Total current liabilities S 540,200 $ 22 Operating Activities Long-term debt S 424,612 $ 23 Net income Common stock (100,000 shares) S 460,000 $ 24 Other additions (sources of cash) Retained earnings S 225,988 S 25 Depreciation Total equity S 685,988 $ S 26 Change in accounts receivable Total liabilities and equity S 1,650,800 $ 27 Change in inventories 28 Change in accounts payable . Other Data 2019 29 Change in accruals December 31 stock price $ 6.00 $ 30 Net cash flow from operations Number of shares 100,000 31 Long-Term Investing Activities Dividends per share $ 0.22 $ 32 Investment in fixed assets Lease payments $ $ 40,000 $ 33 Financing Activities 34 Changes in notes nova 34 Changes in notes payable 25 Chance in boosterm 35 Changes in long-term debt 36 Payment of cash dividends 37 Net cash flow from financing 38 Net reduction in cash account 39 Cash at beginning of year 40 Cash at end of year Ratio Current Quick Inventory turnover wars Days sales outstanding (DSO) Fixed assets turnover Total assets turnover Debt ratio TIE Fixed charge coverage Net profit margin ROA ROE Price/earnings Market/book Industry Avg. 2.7x 1.Ox 6.Ox 32.0 days was 10.7x 2.6x 50.00% 2.5x 2.1x 3.50% 9.10% 18.20% 14.2x 1.4x 145,600 200,000 136,000 481,600 323,432 460,000 203.768 663,768 1,468,800 2018 8.50 100,000 0.22 40,000 41 2018 2019 2018 57,600 351,200 715,200 1,124,000 491,000 146,200 344,800 1,468,800 2 Donna Jamison was recently hired as a financial analyst by Computron Industries, a manufacturer of electronic components. Her first task was to 3 conduct a financial analysis of the firm covering the last two years. To begin, she gathered the following financial statements and other data. 4 5 6 7 Income Statements 2019 2018 Balance Sheets 2019 8 Sales $ 3,850,000 $ S 3,432,000 Assets 9 Cost of goods sold S (3,250,000) $ (2,864,000) Cash $ 52,000 $ 10 Other expenses S (430,300) $ (340,000) Accounts receivable $ 402,000 $ S 11 Depreciation S (20,000) $ (18,900) w Inventories $ 836,000 $ 12 Total operating costs $ 3,700,300 $ 3,222,900 Total current assets $ 1,290,000 $ 13 EBIT $ 149,700 $ 209,100 Gross fixed assets $ 527,000 $ S des 14 Interest expense S non (76,000) $ (62,500) Less accumulated depreciation $ 166,200 S 15 EBT $ S 73,700 $ $ 146,600 Net fixed assets $ 360,800 $ 16 Taxes (40%) S (29,480) $ (58,640) Total assets $ 1,650,800 $ 17 Net income $ S 44,220 $ $ 87,960 Liabilities and Equity 18 EPS Accounts payable S 175,200 $ som 19 Notes payable S o pay 225,000 $ 20 Accruals S 140,000 $ 21 Statement of Cash Flows 2019 Total current liabilities S 540,200 $ 22 Operating Activities Long-term debt S 424,612 $ 23 Net income Common stock (100,000 shares) S 460,000 $ 24 Other additions (sources of cash) Retained earnings S 225,988 S 25 Depreciation Total equity S 685,988 $ S 26 Change in accounts receivable Total liabilities and equity S 1,650,800 $ 27 Change in inventories 28 Change in accounts payable . Other Data 2019 29 Change in accruals December 31 stock price $ 6.00 $ 30 Net cash flow from operations Number of shares 100,000 31 Long-Term Investing Activities Dividends per share $ 0.22 $ 32 Investment in fixed assets Lease payments $ $ 40,000 $ 33 Financing Activities 34 Changes in notes nova 34 Changes in notes payable 25 Chance in boosterm 35 Changes in long-term debt 36 Payment of cash dividends 37 Net cash flow from financing 38 Net reduction in cash account 39 Cash at beginning of year 40 Cash at end of year Ratio Current Quick Inventory turnover wars Days sales outstanding (DSO) Fixed assets turnover Total assets turnover Debt ratio TIE Fixed charge coverage Net profit margin ROA ROE Price/earnings Market/book Industry Avg. 2.7x 1.Ox 6.Ox 32.0 days was 10.7x 2.6x 50.00% 2.5x 2.1x 3.50% 9.10% 18.20% 14.2x 1.4x 145,600 200,000 136,000 481,600 323,432 460,000 203.768 663,768 1,468,800 2018 8.50 100,000 0.22 40,000 41


