Answered step by step
Verified Expert Solution
Question
1 Approved Answer
2019 2020 $ $ Income Stmt info: Sales less Cost of Goods Sold: Gross Profit Operating Expenses Earnings before Interest & Taxes Interest exp earnings
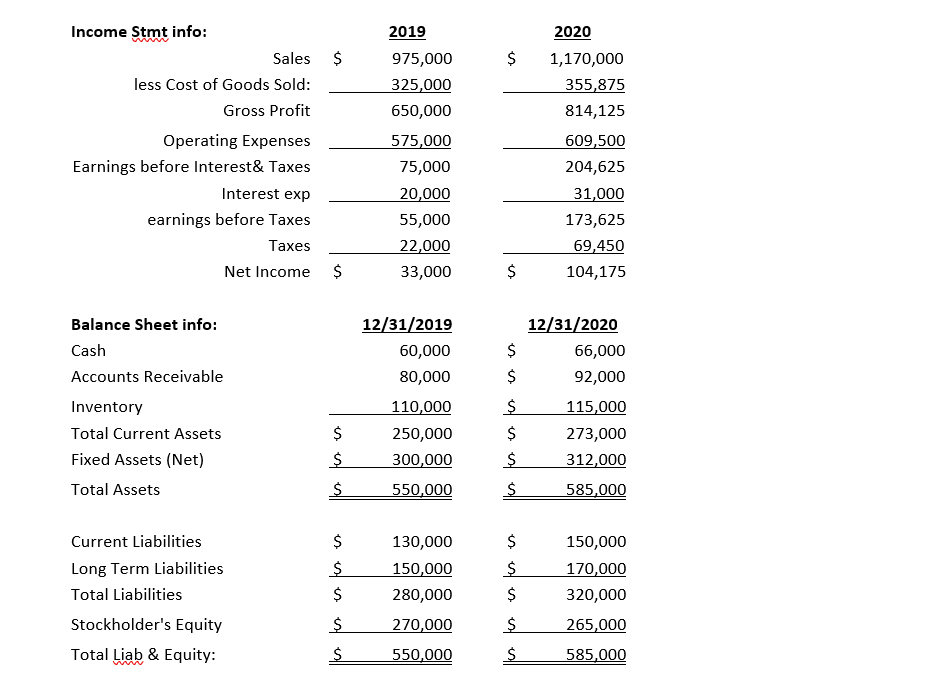
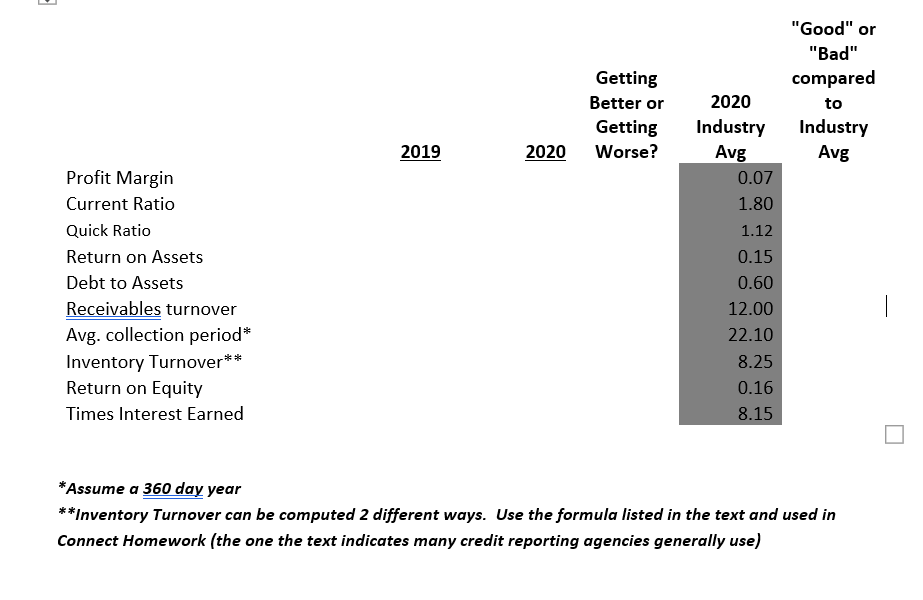
2019 2020 $ $ Income Stmt info: Sales less Cost of Goods Sold: Gross Profit Operating Expenses Earnings before Interest & Taxes Interest exp earnings before Taxes Taxes Net Income 975,000 325,000 650,000 575,000 75,000 20,000 55,000 22,000 33,000 1,170,000 355,875 814,125 609,500 204,625 31,000 173,625 69,450 104,175 $ $ Balance Sheet info: Cash Accounts Receivable Inventory Total Current Assets Fixed Assets (Net) Total Assets 12/31/2019 60,000 80,000 110,000 250,000 300,000 550,000 12/31/2020 $ 66,000 $ 92,000 $ 115,000 $ 273,000 $ 312,000 $ 585,000 $ $ $ $ Current Liabilities Long Term Liabilities Total Liabilities Stockholder's Equity Total Liab & Equity: $ $ 130,000 150,000 280,000 $ $ $ 150,000 170,000 320,000 $ 270,000 $ 265,000 $ 550,000 $ 585,000 "Good" or "Bad" compared to Getting Better or Getting Worse? Industry Avg 2019 2020 Profit Margin Current Ratio Quick Ratio Return on Assets Debt to Assets Receivables turnover Avg. collection period* Inventory Turnover** Return on Equity Times Interest Earned 2020 Industry Avg 0.07 1.80 1.12 0.15 0.60 12.00 22.10 8.25 0.16 8.15 1 *Assume a 360 day year **Inventory Turnover can be computed 2 different ways. Use the formula listed in the text and used in Connect Homework (the one the text indicates many credit reporting agencies generally use)
Step by Step Solution
There are 3 Steps involved in it
Step: 1
Get Instant Access to Expert-Tailored Solutions
See step-by-step solutions with expert insights and AI powered tools for academic success
Step: 2
Step: 3
Ace Your Homework with AI
Get the answers you need in no time with our AI-driven, step-by-step assistance
Get Started